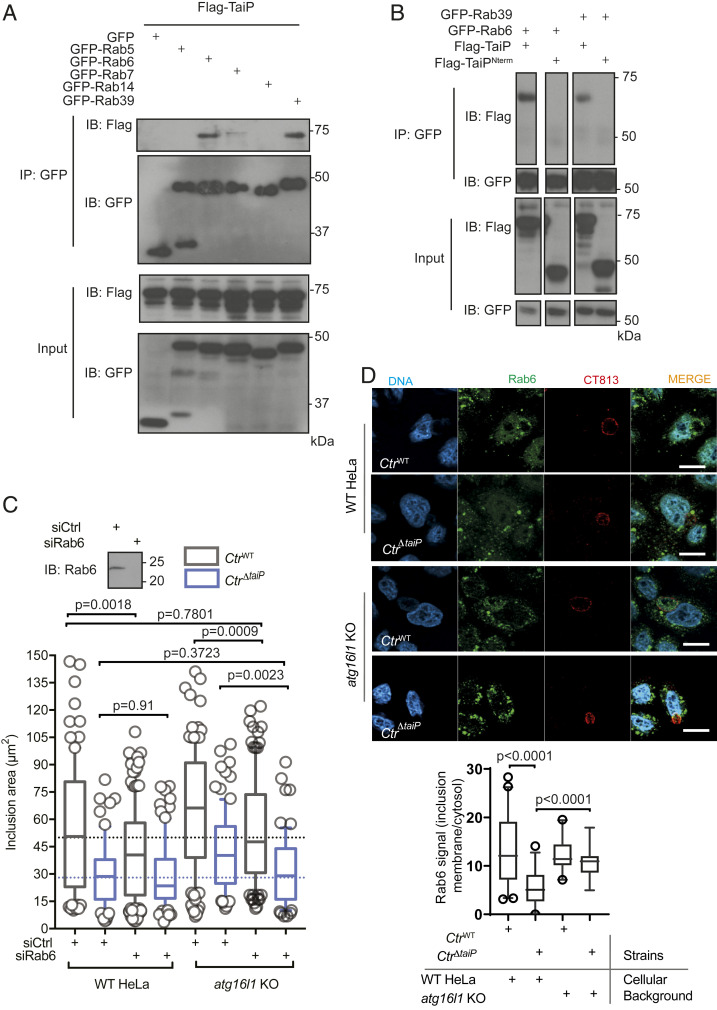
Fig. 4.
TaiP redirects Rab6-positive vesicular traffic to the inclusion. (A) HeLa cells were cotransfected with Flag-TaiP and the indicated GFP-tagged Rab constructs for 24 h. Cells were lysed, and IP was performed with the anti-GFP antibody. Proteins were separated on SDS/PAGE, transferred to a PVDF membrane, and probed with the indicated antibody. An aliquot of each cell lysate was loaded on a separate gel to visualize the expression of Flag-TaiP and of each of the GFP-tagged proteins (input panels). (B) HeLa cells were cotransfected with the indicated constructs for 24 h and analyzed as in B. (C) WT and atg16l1 KO cells were transfected as indicated and infected with CtrWT or CtrΔtaiP the following day at MOI = 0.2. Cells were fixed 20-h postinfection, permeabilized, and the inclusion membrane was stained with anti-Cap1 antibodies. Inclusion areas were measured using imageJ software. The box and whiskers plots display the median area of intracellular inclusions (n > 50 cells from three independent experiments). Statistical analysis was performed using a one-way ANOVA with a Dunnett’s multiple comparison test to siCtrl in WT HeLa. The Inset shows the efficacy of the siRNA against Rab6 at silencing Rab6 expression probed by Western blot. (D) WT and atg16l1 KO cells were infected with CtrWT or CtrΔtaiP the following day at MOI = 0.2. Some 20 h after infection, the cells were treated with 10 nM nocodazole and incubated further for 60 min before fixation. After permeabilization, the cells were stained with rabbit antibodies against endogenous Rab6 and mouse antibodies against the inclusion membrane protein CT813. Representative images are shown. (Scale bar: 10 µm.) The box and whiskers plot displays the median intensity of the Rab6 staining at the inclusion periphery, relative to its cytosolic intensity (n > 50 cells from three independent experiments, see Methods for details). Statistical analysis was performed using Student’s t test.

