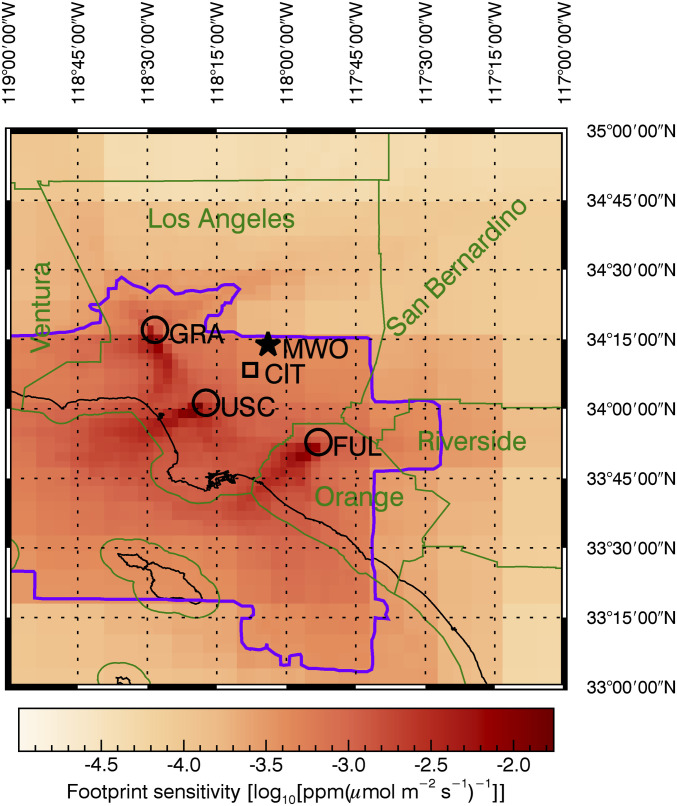
Fig. 1.
Annual average footprint (surface flux sensitivity) for the three Los Angeles Megacity Carbon Project sampling sites used in this study (open circles). Green lines represent county boundaries. The purple line represents the 50% influence contour (50% of the total footprint influence is inside the contour). The full domain of the footprints (which go back 60 h) is from 121°W–114°W and 31.4°N–36.8°N and includes substantial portions of desert and ocean. Also note that the WRF-STILT footprint model decreases its resolution away from the sampling sites, as can be seen in the block-like nature of the footprints and contours. The star represents the high-altitude background site (MWO), and the square shows the location of Newman et al. (2016) Pasadena (CIT) samples discussed in the text (27).

