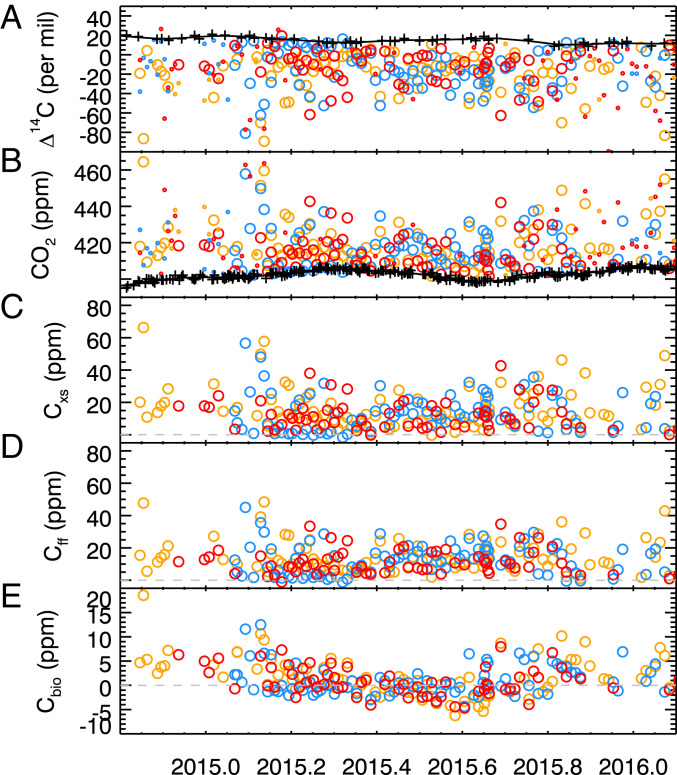
Fig. 2.
Time series of measured (A and B) and derived (C–E) quantities from three different sampling sites, as described in the main text. Orange is USC; Blue is GRA; Red is FUL. Black line and crosses are the MWO (background) smooth curve and data, respectively. Small symbols in A and B represent data with windspeeds less than 1.5 m s-1 or wind directions from over building rooftops.

