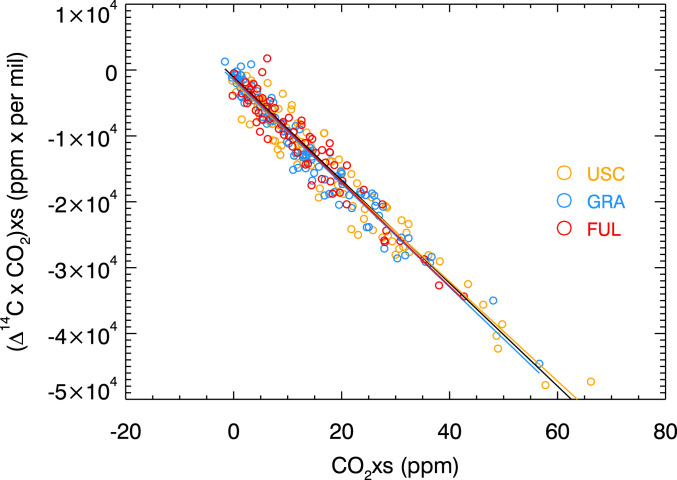
Fig. 3.
Isotope mixing analysis. The slopes of the fitted lines are isotope signatures of the flux-weighted sources, calculated as described in the main text. Colored lines represent the fits to data from each site, and the black line represents the fit to data from all sites. The slope of the black line is −783 ± 11‰ indicating a substantial contribution of biogenic sources to observed CO2 variability, as discussed in the text. Only data passing windspeed and direction filtering criteria are shown and used in the regression. Linear regressions are calculated following the method of York et al. (2004) as described in SI Appendix (42).

