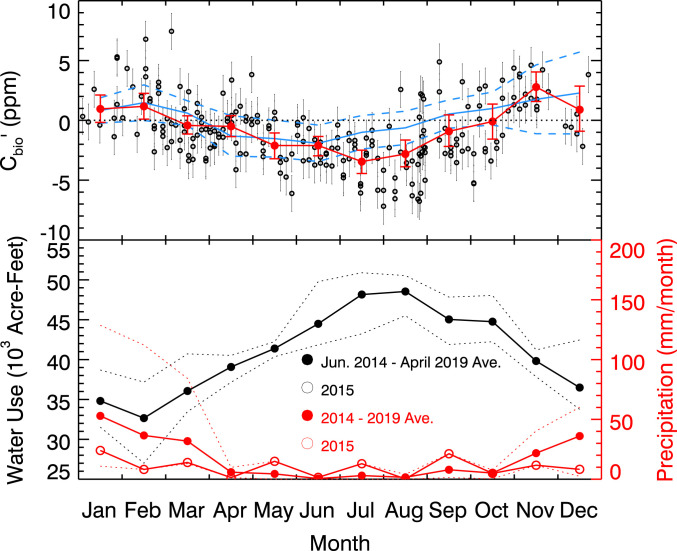
Fig. 4.
(Top) The urban biospheric fraction of the excess CO2 signal (Cbioʹ) shown for all samples (passing windspeed and wind direction screening) as open black circles with one-sigma random errors. Monthly mean Cbioʹ values are overplotted as filled red symbols. Red error bars represent 95% confidence intervals (CIs) for the means, calculated using a bootstrap method, as described in SI Appendix. The solid blue line shows the 2006–2015 mean monthly Cbioʹ from CIT (using LJO and BRW as background for CO2 and Δ14C, respectively), with the 10-y SDs shown in dashes. (Bottom) Water inputs to the study domain. Black symbols and lines represent total water usage for the area served by the L.A. Department of Water and Power as reported to the State of California Water Board (https://www.waterboards.ca.gov/water_issues/programs/conservation_portal/conservation_reporting.html, accessed June 2019). Red symbols and lines represent monthly total precipitation from the Global Precipitation Climatology Project (GPCP v1.3) for the 1° × 1° degree grid cell containing the city of L.A. Red and black dashed lines represent the upper and lower bounds for the date ranges in the legend of either city water usage or precipitation and are referenced to the respective solid line with solid symbols. The lines with open symbols represent water usage or precipitation for 2015.

