Fig. 1.
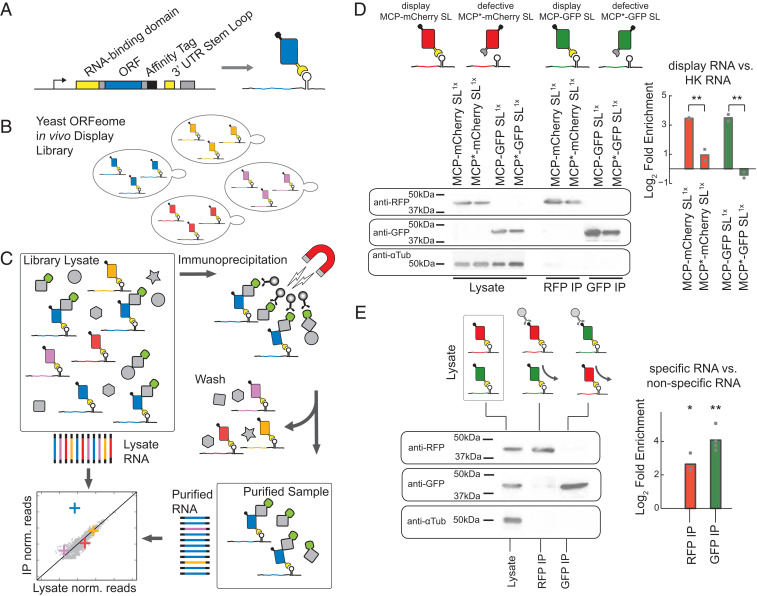
High-throughput proteomics using in vivo mRNA display and NGS. (A) N-terminal MS2 coat protein fused to a gene of interest binds the RNA stem loop present on the 3′ untranslated region (UTR) of its encoding mRNA. (B) In vivo mRNA display libraries of the yeast ORFeome consist of a mixed population of strains, each expressing a single displayed protein interacting with its native cellular environment independently of other library species. (C) A proteomic assay with RNA sequencing as the readout. Scheme for a copurification assay of a given bait from in vivo mRNA display extracts, whereby RNA is processed from both purified and input lysates. Potential interactors are detected by comparing RNA read frequencies in the two samples for each displayed mRNA. (D) Log2 fold enrichment of displayed mRNA for purified proteins compared with the lysate is calculated using qPCR for a given construct with ACT1 as a reference housekeeping (HK) gene. Two in vivo display constructs (MCP-mCherry, MCP-GFP) vs. defective coat protein constructs (MCP*-mCherry, MCP*-GFP) show significant relative enrichment (P = 0.002, P = 0.009, one-way ANOVA). (E) Log2 fold enrichment of displayed mRNA for purified proteins from a mixed construct population (MCP-mCherry and MCP-GFP) for anti-RFP and anti-GFP purifications. The mRNA species of each specific protein is enriched relative to the input lysate over the nonspecific species (RFP-IP: P = 0.016; GFP-IP: P = 0.001, t test). For all purifications, cropped western blot images against RFP, GFP, and α-Tubulin are shown to the left (full images are in SI Appendix, Fig. S2). Biological replicates are represented as gray dots; bars represent mean signal; **P < 0.01, *P < 0.05.

