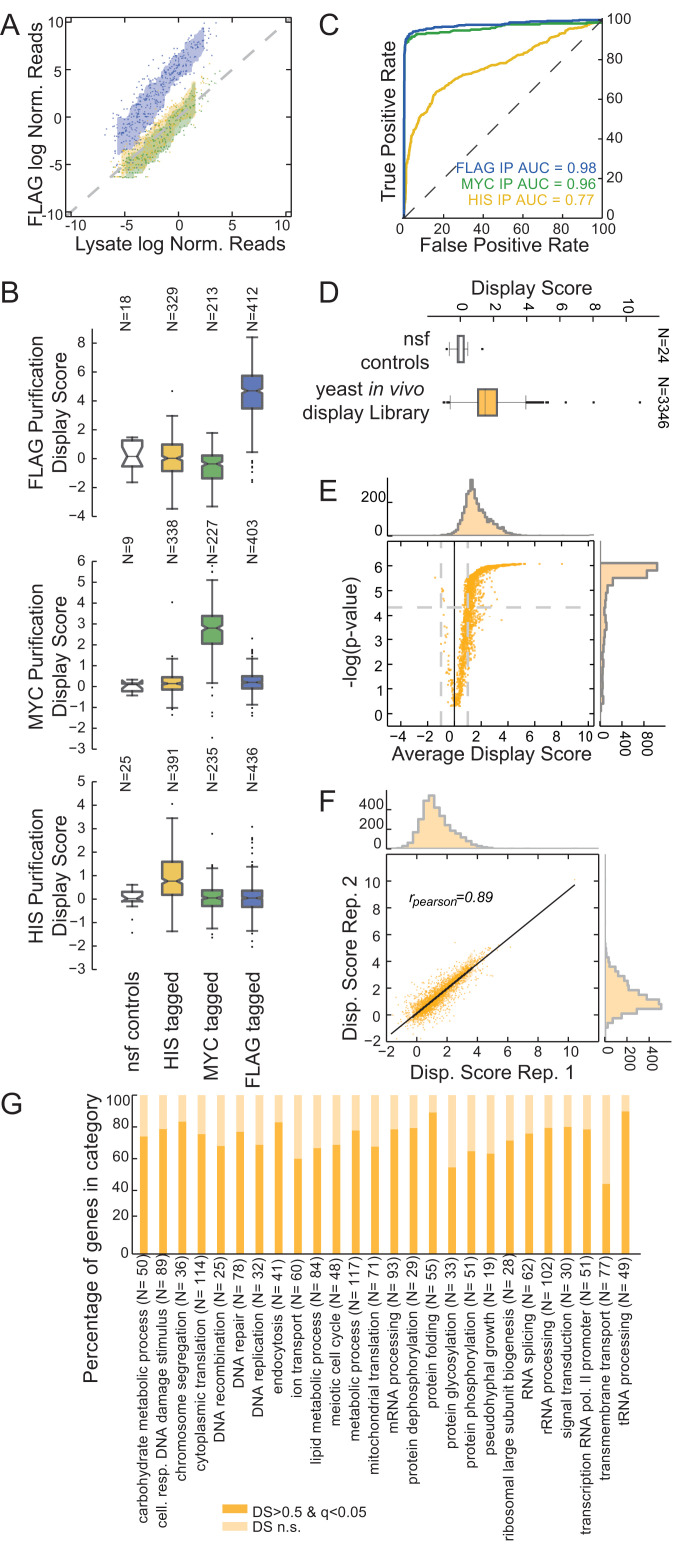
Fig. 2.
In vivo mRNA display enables precise protein identification in a complex mixture. (A) Assessment of in vivo mRNA display precision by identification of a specific protein subpopulation. Anti-FLAG immunoprecipitation from a mixed population containing HIS-tagged (yellow), MYC-tagged (green), and FLAG-tagged (blue) yeast in vivo mRNA display constructs. Scatterplot for log-normalized reads for the lysate (x axis) against the purified samples (y axis). Reads for each sample were normalized by the mean of nonspecific functional controls. For each population, the area between rolling 10th and 90th percentiles is shaded with the respective color. (B) DS box plots for anti-FLAG, anti-MYC, and anti-HIS purifications. Shown are box plots of DSs for each subpopulation and the nonspecific functional controls (nsf). The box extends from the lower to the upper quartile values, while whiskers extend 1.5 times the interquartile range from the edge of the box, and outliers are shown as individual points. (C) Receiver operating characteristic curves for the purifications in B. Members of the mixed library were classified according to their respective DSs. (D) Yeast in vivo mRNA display library purification. Average DSs were calculated per gene for over 3,300 ORFs over four biological replicates. Shown is a box plot for the ORFs in the library compared with the set of nonspecific functional controls. (E) Volcano plot for the DS of the yeast library purifications. P values were calculated with respect to the nonspecific functional controls (SI Appendix) (q values calculated using a Benjamini–Hochberg correction). (F) Scatter plot for DSs between two replicates (Pearson correlation is reported). (G) Percentage of in vivo mRNA display proteins with significant and nonsignificant (n.s.) DSs per gene ontology biological process category.

