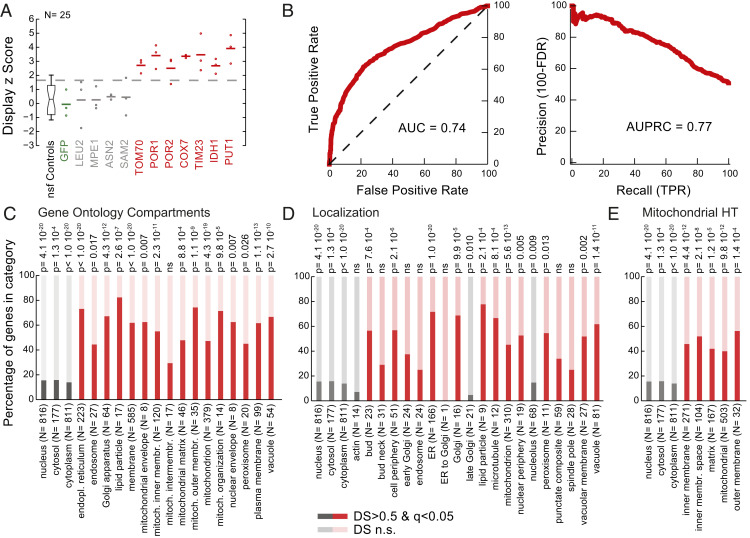
Fig. 3.
In vivo mRNA display captures native protein localization. (A) Display z scores of the enrichment for individual mRNAs in a crude mitochondrial isolation. Replicates are denoted with circles, while averages are reported as horizontal lines. z scores were calculated with respect to the nonspecific functional (nsf) controls. (B) Receiver operating characteristic and precision recall curves for the crude mitochondrial isolation. Members of the library were classified according to their respective DS and compared with the GO term compartment categories. True positive rates (TPR), false positive rates (FPR), and false discovery rates (FDR) were calculated. Area under the curve (AUC) and area under the precision recall curve (AUPRC) values are reported. (C–E) Percentage of in vivo mRNA display proteins with significant and nonsignificant (n.s.) DSs per (C) GO term compartment category, (D) localization category (58), and (E) high-throughput (HT) mitochondrial study (59). Categories specific to the crude mitochondrial enrichment are shown in red, while cytoplasmic and nuclear fractions are reported in gray. Organelle and membrane proteins are significantly enriched, while cytosolic proteins are depleted (hypergeometric test for P values, nonsignificant P values marked as ns).

