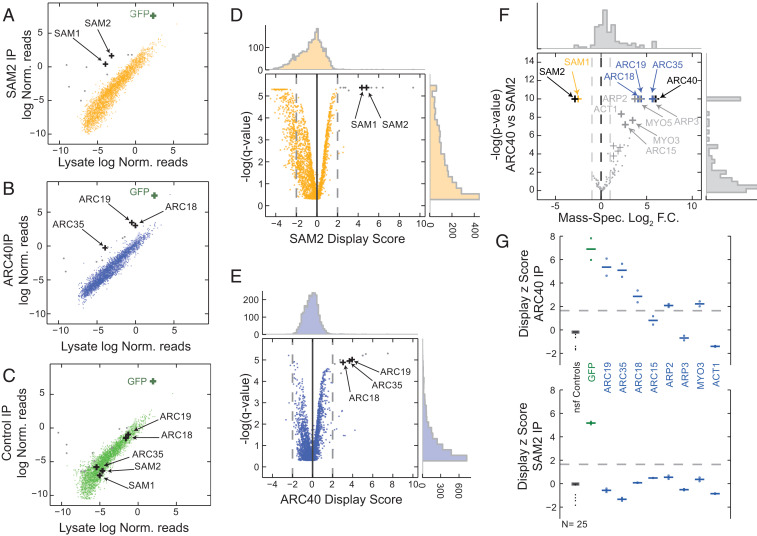
Fig. 4.
In vivo mRNA display enables high-throughput protein interaction assays. (A–C) Copurification using anti-GFP magnetic beads from SAM2-GFP (A), ARC40-GFP (B), or control GFP (C). Experiments were performed in biological quadruplicates. Scatterplots are shown for the log-normalized reads for the lysate (x axis) against the purified samples (y axis). The area between rolling 10th and 90th percentiles is shaded with the respective color. GFP mRNA is a positive control for the assay and is enriched in all three purifications. Hits for SAM2 and ARC40 are noted as black crosses. Gray dots denote nonspecific ARC40 and SAM2 hits that are also significantly enriched in the GFP samples (common background). (D and E) Volcano plots for the DS for SAM2 (D) and ARC40 (E). P values were calculated with respect to the nonspecific functional controls (SI Appendix). (F) Volcano plot for mass spectrometry of purified SAM2 and ARC40 samples (black crosses). The common hits for both MS and in vivo mRNA display for the two purified proteins are shown in yellow and blue, respectively. The remainder MS hits are denoted in gray. Log2 fold change (F.C.) is plotted against -log P values. (G) Display z scores for individual ARC40 interactors in a low-throughput purification of ARC40 (Upper) and SAM2 (Lower). Replicates are denoted with circles, while averages are reported as horizontal lines; z scores were calculated with respect to the nonspecific functional (nsf) controls (shown in black).

