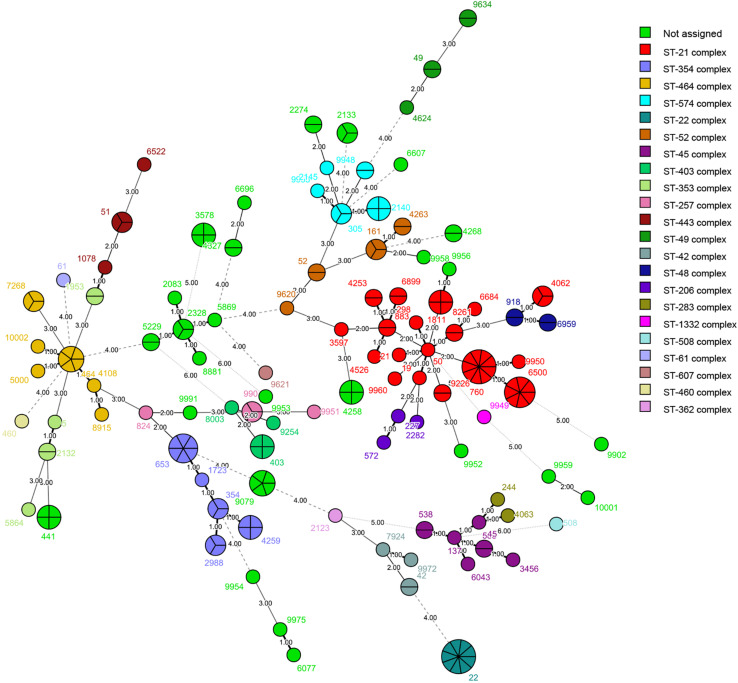
FIGURE 1.
Phylogenetic analysis. Minimum spanning tree (MST) of MLST data of 200 C. jejuni human isolates collected in 2017 and 2018 in Beijing, China. Each color represents one clonal complex (CC). Isolates are represented by circles, and the size of the circle is proportional to the number of isolates. Branches and numbers represent allelic differences between isolates.

