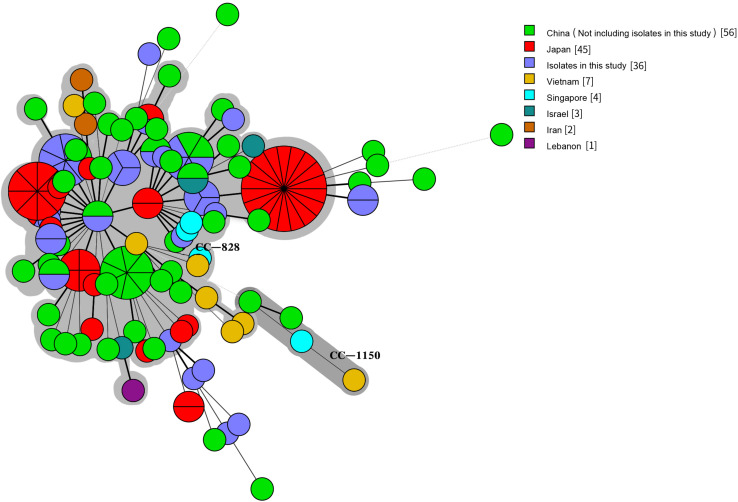
FIGURE 6.
Genetic relationships among the 36 clinical isolates C. coli in this study and 118 isolates C. coli from Asia in the pubmlst database (Data taken time: January 18, 2019). A minimum spanning tree was reconstructed based on CCs from this study and the MLST database. The size of circles is proportional to the number of isolates, and the sources of isolates are colored as indicated. Shadow zones in different color represent different clonal complexes.

