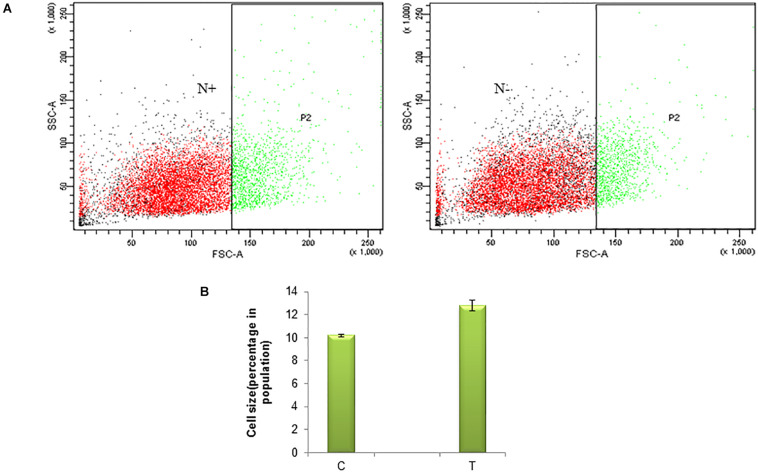
FIGURE 1.
Nitrogen stress induced morphological variation in a population of S. quadricauda. (A) Flow cytometry analysis of control (N+) and nitrogen starved (N–) S. quadricauda P2 represents the population and SSC-A, FSC-A represents the Side Scattered light-Area. Forward Scattered light-Area respectively. (B) Population statistics of enlarged cells during nitrogen starvation (T) and control S. quadricauda. The mean values of three independent triplicates (n = 3) were plotted with standard deviation as error bars.

