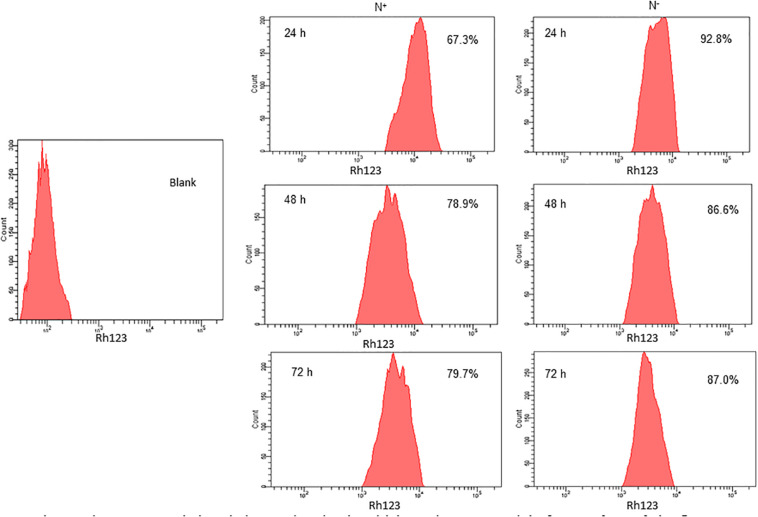
FIGURE 2.
Nitrogen stress induced changes in mitochondrial membrane potential of 5. quadricauda by flow cytometry. Mitochondria were stained by Rhodamine123. Blank represents the auto fluorescence of S.quadricauda; N+-control. N– – Nitrogen starved S. quadricauda at 24 h. 48 and 72 h. The experiments were carried out in duplicates (n = 2). The percentage values in each histogram represents the percentage cells retained the fluorescence of Rh 123 and the population of cells were fixed at 8000.

