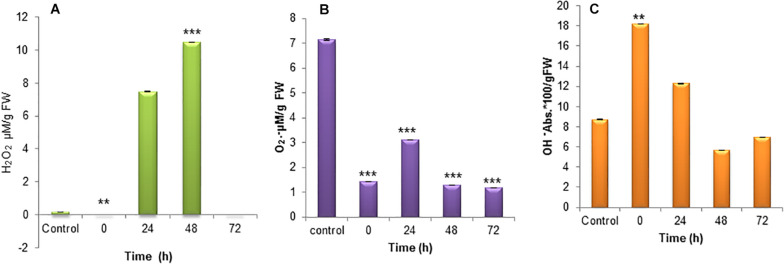
FIGURE 3.
Reactive Oxygen species generation in nitrogen stress induced (N–) S. quadricauda and control (N+). (A) H2O2, (B) O2⋅−, and (C) OH– generation during nitrogen stress induced at 0, 24, 48, and 72 h and the control S. quadricauda. The experiments were carried out in triplicate (n = 3) and the values were represented as a mean value with ± standard deviation as error bars. One-way ANOVA followed by Tukey HSD test for each treatment with respect to control. **Iindicate significant differences compared to control (P < 0.01). ***Indicates highly significant differences compared to control (P < 0.001).

