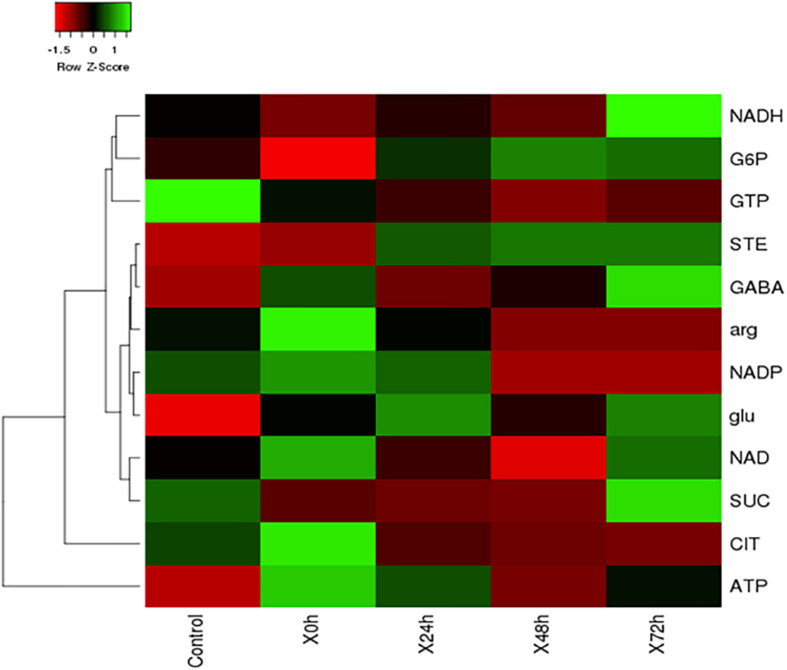
FIGURE 5.
The heat map of nitrogen stress induced S. quadricauda at 0, 24, 48, and 72 h and the control i.e., nitrogen sufficient S. quadricauda represented in X axis. The targeted metabolites were represented in Y axis and the map was generated by heat mapper. The mean values of experimental duplicates (n = 2) were used to generate metabolite expression heat map.

