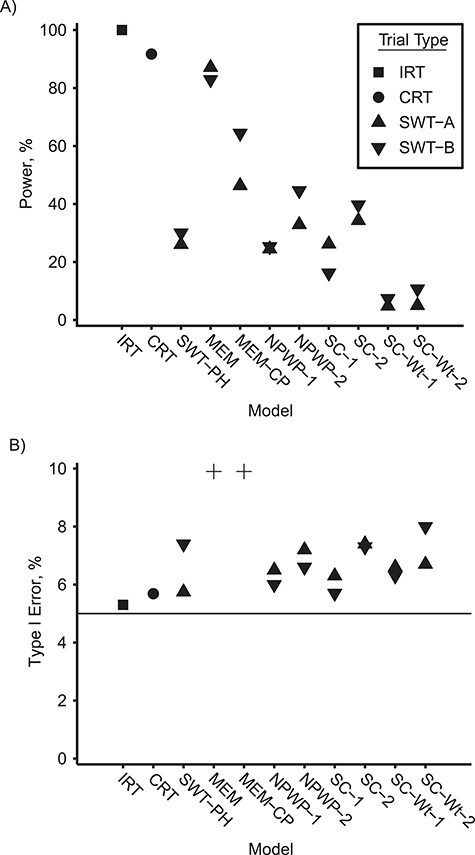
Figure 2.

Power and type I error by model for an analysis of vaccine efficacy in an outbreak setting. Empirical power for direct vaccine effect of 0.6 (A) and empirical type I error for direct vaccine effect of 0 (B) with a basic reproduction number, R0, of 2.47 for individually randomized trial analyzed with stratified Cox model (IRT), cluster-randomized trial analyzed with a Cox model with a gamma-distributed shared frailty (CRT), and stepped wedge trials with 4 clusters crossing over every 28 days (SWT-A) and with 1 cluster crossing over every 7 days (SWT-B) analyzed by a Cox model with a gamma-distributed shared frailty (SWT-PH), mixed effects model (MEM), mixed effects model with cluster-period random effect (MEM-CP), nonparametric within-period method equally weighted across periods (NPWP-1) and weighted across periods by total case count (NPWP-2), and synthetic control method equally weighted across clusters and periods (SC-1), equally weighted across clusters and weighted across periods by total case count (SC-2), weighted across clusters by inverse mean square prediction error and equally weighted across periods (SC-Wt-1), and weighted across clusters by inverse mean square prediction error and across periods by total case count (SC-Wt-2). Four type I error values greater than 10% are denoted by “+” in (B): SWT-A MEM (72%), SWT-B MEM (72%), SWT-A MEM-CP (28%), and SWT-B MEM-CP (52%). The horizontal line in (B) denotes the nominal type I error of 5%.
