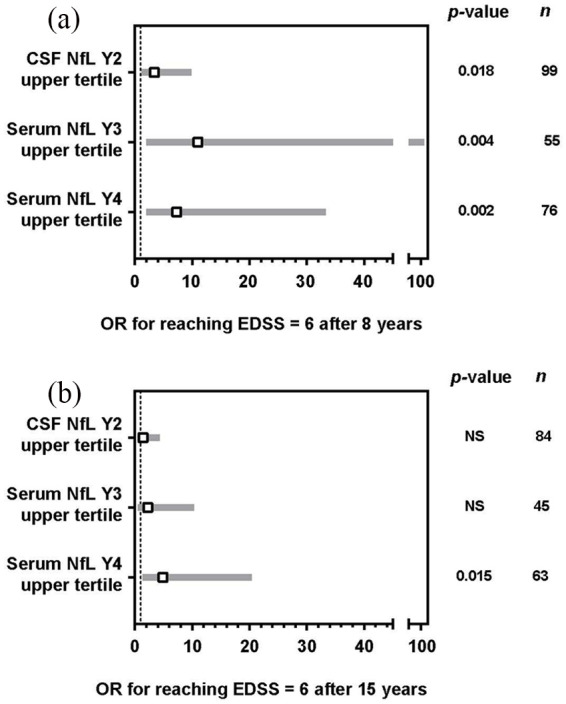
Figure 3.

ORs for reaching an EDSS score of 6.0. (a) After 8 years of follow-up. (b) After 15 years of follow-up. For the purpose of illustration, the range of NfL assessments was broken down into tertiles; n indicates the total for each category. Hypothesis testing of the association of NfL levels with cumulative incidence of progression to EDSS score ⩾6.0 was conducted using Fisher’s exact test, as well as Wald chi-square test based on Firth’s penalized univariate logistic regression. OR are shown relative to the lowest tertile.
EDSS: Expanded Disability Status Scale; NfL: neurofilament light chain; NS: not significant; OR: odds ratio.
