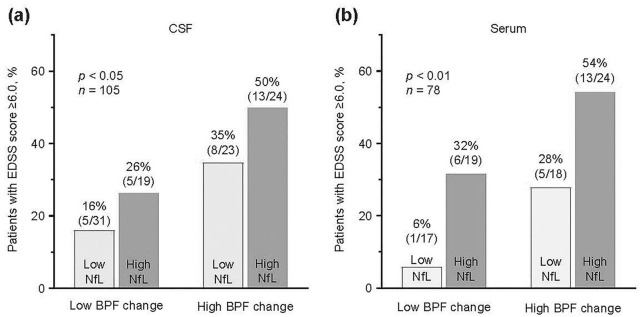
Figure 4.
Proportion of patients reaching EDSS score ⩾6.0 at Year 8 stratified by BPF change and NfL levels. (a) CSF: the proportion of patients reaching an EDSS ⩾6.0 at Year 8 was stratified by BPF change from Year 0 to Year 2 and mean (Year 0 and Year 2) CSF NfL levels (below or above median). (b) Serum: the proportion of patients reaching an EDSS ⩾6.0 at Year 8 was stratified by BPF change from Year 0 to Year 2 and mean (Year 3 and Year 4) serum NfL levels (below or above median). Hypothesis testing of the association of NfL levels with cumulative incidence of progression to an EDSS score ⩾6.0 was conducted using Fisher’s exact test. Mean NfL levels represent the mean of two time points when both measurements were available, and a single value when only one measurement was available. Light gray bars indicate NfL below median; dark gray bars indicate NfL above median.
BPF: brain parenchymal fraction; CSF: cerebrospinal fluid; EDSS: Expanded Disability Status Scale; NfL: neurofilament light.

