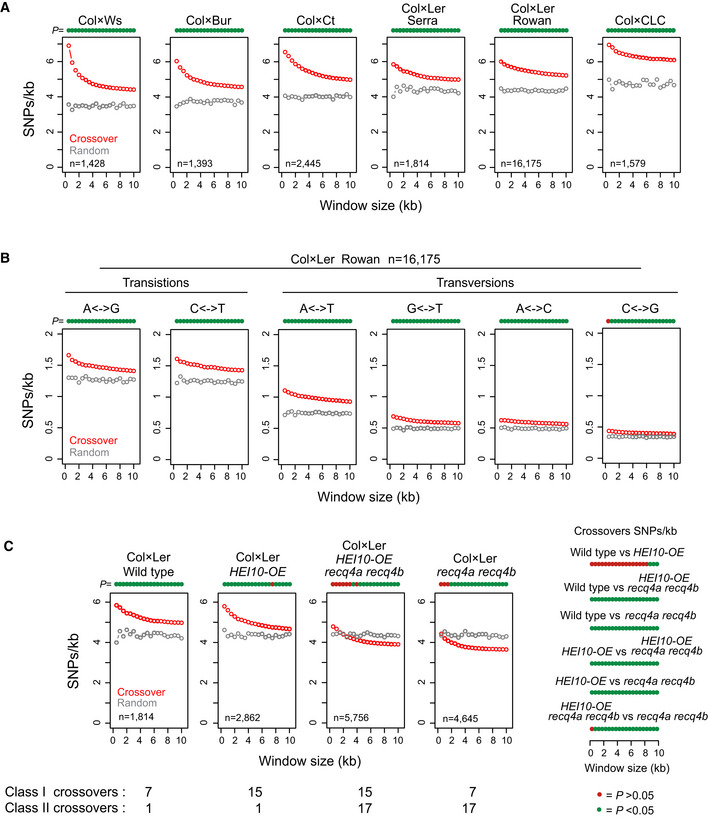
Figure 3. Crossovers are positively associated with SNP density at the local scale.

- SNPs/kb in physical windows of increasing size (kb) around crossover midpoints (red), or for matched randomly chosen positions (grey). Printed above the plot for each window are circles coloured green if crossover SNPs/kb values are significantly different to random (P < 0.05), or red if not (P > 0.05; Bonferroni‐adjusted t‐tests). The population (Col × Ws, Col × Bur (Lawrence et al, 2019), Col × Ct, Col × Ler (Serra et al, 2018b; Rowan et al, 2019) and Col × CLC) is printed above each plot, and the number of positions analysed is printed inset.
- As for A, but analysing the indicated Col/Ler transition and transversion polymorphisms around Col × Ler crossovers (Rowan et al, 2019) (red), or the same number of random positions (grey).
- As for A, but analysing Col/Ler SNPs/kb around crossovers from wild type, HEI10‐OE, recq4a recq4b or HEI10‐OE recq4a recq4b (Serra et al, 2018b). All populations were generated from Col × Ler hybrids. Printed beneath are the estimated average numbers of Class I and Class II crossovers per meiosis for each genotype, measured via genotyping‐by-sequencing (Ziolkowski et al, 2017; Serra et al, 2018b). To the right are plots showing the significance of SNPs/kb differences between crossover sets, across the windows tested (Bonferroni‐adjusted t‐tests).
