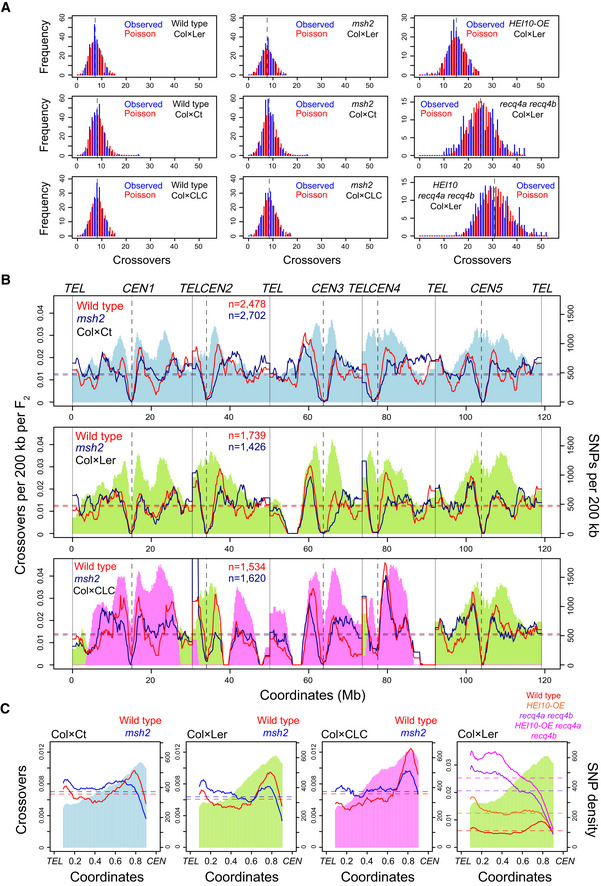
Figure 4. Remodelling of the crossover landscape in msh2 .

- Histograms of observed crossovers per F2 individual in the indicated wild type and msh2 populations, from Col × Ct, Col × Ler and Col × CLC crosses (blue). The Poisson expectation is plotted in red. Data from HEI10‐OE, recq4a recq4b and HEI10‐OE recq4a recq4b F2 populations are also shown for comparison (Ziolkowski et al, 2017; Serra et al, 2018b). Mean values are indicated by black dotted lines.
- Crossovers per 200 kb per F2 plotted along the Arabidopsis chromosomes, with mean values shown by horizontal dashed lines. Data are shown for wild type (red) and msh2 (blue) crossovers generated from Col × Ct, Col × Ler and Col × CLC hybrids. SNPs per 200 kb are shaded in colour (blue = Col/Ct, green = Col/Ler, pink = Col/Cvi). The positions of telomeres (TEL) and centromeres (CEN) are labelled. The number of crossovers analysed is printed inset.
- Data as for B, but analysing crossovers in wild type (red) and msh2 (blue), or SNPs along proportionally scaled chromosome arms orientated from telomeres (TEL) to centromeres (CEN). Crossover data from HEI10‐OE, recq4a recq4b and HEI10‐OE recq4a recq4b Col × Ler F2 populations are also shown (Ziolkowski et al, 2017; Serra et al, 2018b).
