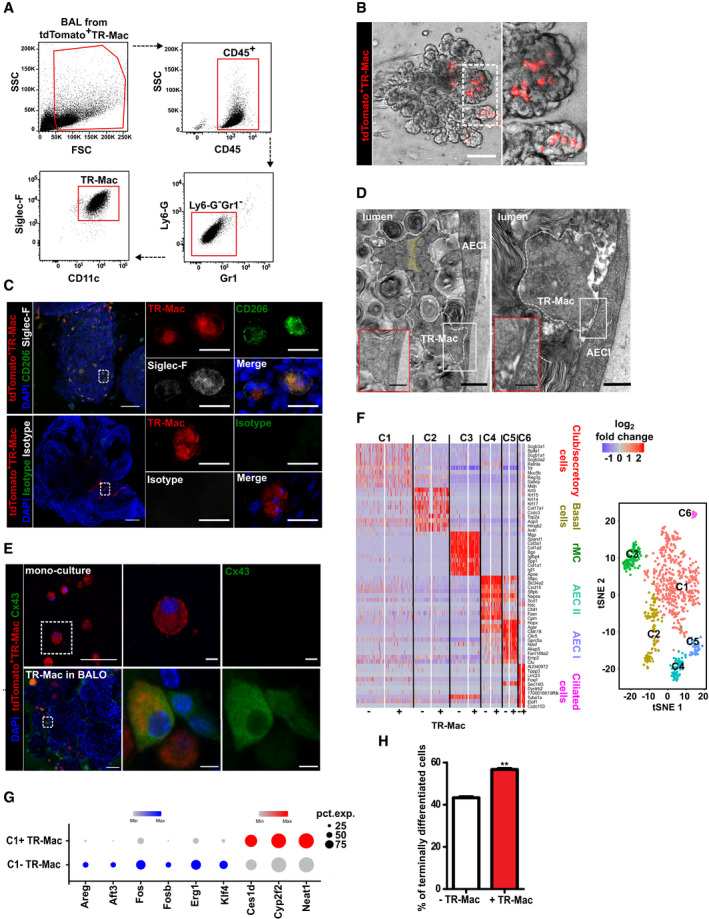
Gating strategy to define TR‐Mac from BAL of adult tdTomato+ mice.
Representative images of BALO after microinjection of tdTomato+ TR‐Mac at day 14. TR‐Mac are preferentially found in alveoli (right). Scale bars represent 100 μm (left) and 50 μm (right).
Fluorescence confocal images of CD206, Siglec‐F, and isotype control staining 14 days after tdTomato+ TR‐Mac microinjection in a day 28 BALO. Scale bars represent 100 μm (left) and 25 μm (right).
Electron microscopy depicting filopodium of TR‐Mac (white dashed lines) with a characteristic actin filament bundle (yellow background) (left panel) in contact with AEC I within BALO alveolar‐like structures. Uptake of surfactant by TR‐Mac is depicted by a (*). Scale bar indicates 1,000 nm (left, in insert: 500 nm) and 500 nm (right, in insert: 250 nm).
Representative confocal images of Cx43 staining in tdTomato+ TR‐Mac monoculture in Matrigel and tdTomato+ TR‐Mac microinjected at day 14 and analyzed in a mature day 21 BALO. Scale bars represent 50 μm (overview) and 5 μm (close up).
Heat map (left) and tSNE plot (right) of the comparative analysis of digested day 23 BALO cultures with (+) and without (−) microinjected TR‐Mac depicting six distinct clusters (C1, club/secretory cells, red; C2, basal cells, yellow; C3, rMC, green; C4, AEC II, blue; C5, AEC I, purple; and C6, ciliated cells, pink).
Expression data dot plots of genes found differentially regulated in cluster C1 between day 23 BALO with (C1+) and without (C1−) microinjected TR‐Mac. The circle size illustrates the number of cells expressing a specific gene.
Percentage of terminally differentiated cells (AEC I and ciliated cells) in day 23 BALO cultures with (+) and without (−) microinjected TR‐Mac.
Data information: Bar and dot charts presented as the mean ± SEM and probability determined using
< 0.01).

