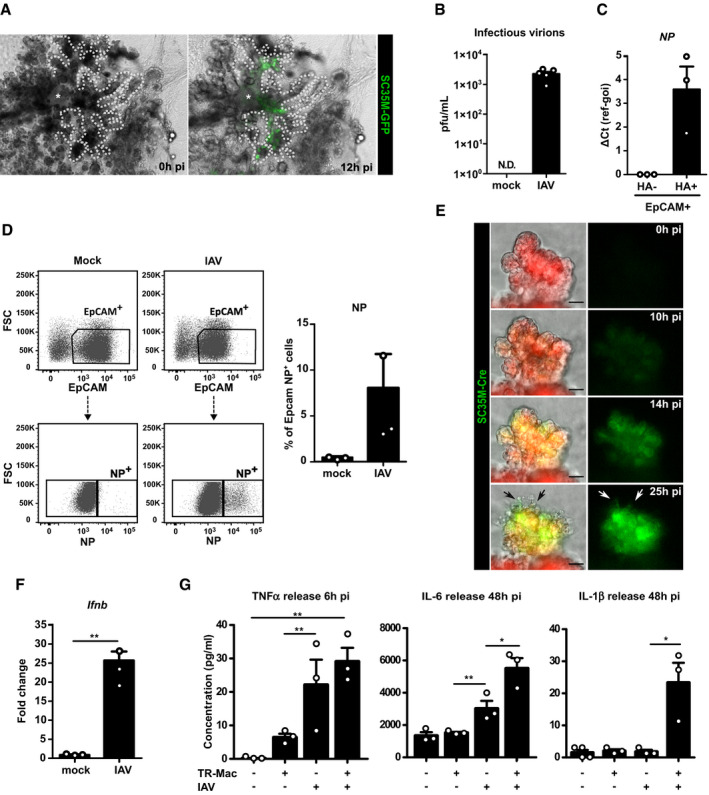
Figure 6. BALOs support influenza virus infection and allow modeling of lung infection and injury.

- Representative images of day 21 BALO after microinjection of SC35M‐GFP IAV (green) into the central airway‐like (*) after 0 and 12 h pi visualize IVA spread to the alveolar‐like regions. Dotted lines illustrate BALO borders. Scale bars represent 100 μm.
- Quantification of plaque‐forming units in supernatants from mock or SC35M IAV‐infected BALO 48 h after infection (n = 5 biological replicates). N.D.: not detectable.
- Relative NP expression in PR8 IAV‐infected (HA+) or non‐infected (HA−) epithelial cells isolated from BALOs 48 h pi, FACS‐sorted according to EpCAM and HA expression (n = 3 biological replicates with pooled cells from 4 cultures per replicate).
- Representative flow cytometric data showing the percentage of EpCAM+NP+ cells in mock‐ and SC35M IAV‐infected BALOs at 48 h pi in n = 3 biological replicates with pooled cells from 4 cultures per replicate.
- Representative fluorescence images of a day 21 distal region in BALO generated from mTmG reporter mouse and infected by SC35M‐Cre IAV after 0, 10, 14, and 25 h. Arrows indicate cell death. Scale bars represent 25 and 10 μm in the insert.
- mRNA expression of Ifnb in mock and PR8 IAV‐infected BALOs at 48 h pi (n = 3 biological replicates with pooled cells from 4 cultures per replicate).
- Release of TNF‐α (6 h pi), IL‐6 (48 h pi), and IL‐1β (48 h pi) detected by Bio‐Plex® Multiplex immunoassay in the supernatant of mock and IAV‐infected BALO cultures with and without TR‐Mac (n = 3 biological replicates).
