-
A–C
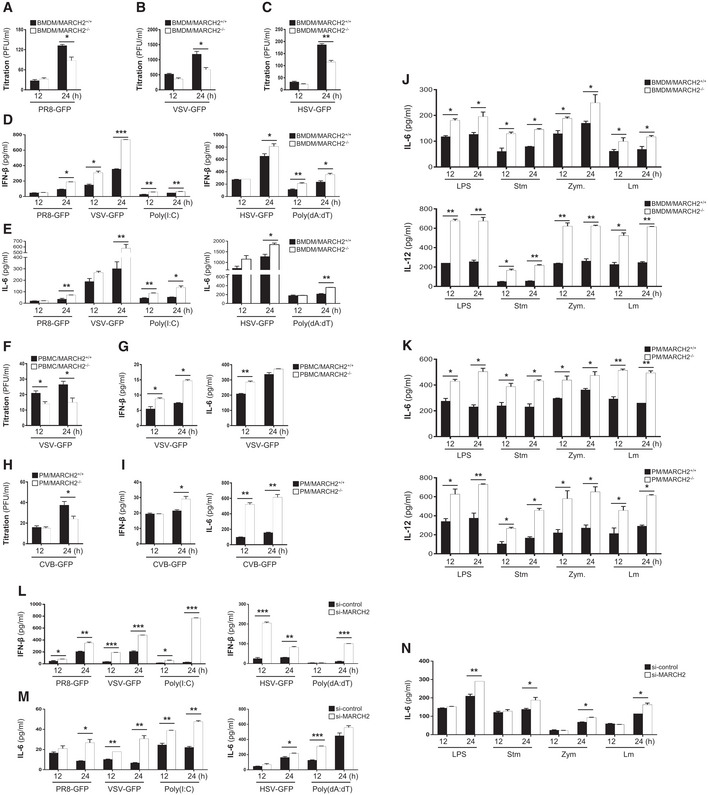
BMDMs isolated from MARCH2+/+ or MARCH2−/− mice were infected with PR8‐GFP (A, MOI = 3), VSV‐GFP (B, MOI = 5), or HSV‐GFP (C, MOI = 3), and virus titer was measured in a plaque assay.
-
D, E
BMDMs isolated from MARCH2+/+ or MARCH2−/− mice were infected with viruses or treated with poly(I:C) (80 μg/ml) or poly (dA:dT) (1 μg/ml). The concentration of secreted IFN‐β (D) and IL‐6 (E) in the supernatants was measured in an ELISA.
-
F, G
PBMCs isolated from whole peripheral blood from MARCH2+/+ or MARCH2−/− mice were infected with VSV‐GFP (MOI = 1). (F) The virus titer was measured in a plaque assay. (G) Concentration of IFN‐β and IL‐6 in the supernatant was measured in an ELISA.
-
H, I
PMs isolated from MARCH2+/+ or MARCH2−/− mice infected with CVB‐GFP (MOI = 3). (H) Virus titer was measured in a plaque assay. (I) Concentration of IFN‐β and IL‐6 in the supernatant was measured in an ELISA.
-
J, K
BMDMs (J) or PMs (K) isolated from MARCH2+/+ or MARCH2−/− mice were infected with Salmonella typhimurium or Listeria monocytogenes, or treated with LPS or zymosan. The concentration of IL‐6 and IL‐12 in supernatant was analyzed in an ELISA.
-
L, M
RAW 264.7 cells transfected with control siRNA (si‐control) or MARCH2‐specific siRNA (si‐MARCH2) were infected with PR8‐GFP (MOI = 1), VSV‐GFP (MOI = 0.5), poly(I:C) (20 μg/ml) or HSV‐GFP (MOI = 1) poly (dA:dT) (1 μg/ml), and IFN‐β (L), and IL‐6 (M) levels in the supernatant were measured in an ELISA.
-
N
RAW 264.7 cells transfected with control siRNA (si‐control) or MARCH2‐specific siRNA (si‐MARCH2) were infected with S. typhimurium or L. monocytogenes, or treated with LPS (100 ng/ml) or zymosan (100 μg/ml), and IL‐6 secretion into the cell supernatant was measured in an ELISA
test). Data are representative of three independent experiments, each with similar results, and expressed as the mean ± SD of two biological replicates.

