-
A–D
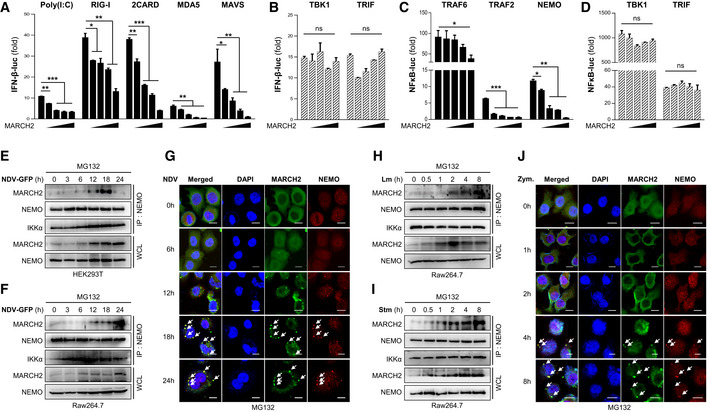
HEK293T cells were transfected with a firefly luciferase reporter plasmid encoding the IFN‐β promoter (A, B) or the NF‐κB promoter (C, D), plus a TK‐Renilla plasmid and an increasing dose of flag‐tagged MARCH2 plasmid (50, 100, 200, 400 ng) plus expression plasmids for RIG‐I 2CARD, RIG‐I, MDA‐5, MAVS, TBK1, TRAF 6, TRAF 2, NEMO, or TRIF, or stimulated with poly(I:C), for 24 h. Results are expressed relative to those of Renilla luciferase alone (internal control).
-
E, F
Interaction between MARCH2 and NEMO in response to viral infection. HEK293T cells (E) or Raw264.7 cells (F) were infected with NDV‐GFP in a time‐dependent manner in the presence of MG132 (proteasome inhibitor, 10 μM). Cell lysates were subjected to immunoprecipitation with an anti‐NEMO antibody, followed by immunoblotting with an anti‐MARCH2 antibody.
-
G
Confocal microscopy was conducted to examine time‐dependent co‐localization of MARCH2 and NEMO in HeLa cells upon NDV infection (MOI = 1) in the presence of MG132 (10 μM). Arrow indicates the co‐localized NEMO and MARCH2 protein.
-
H, I
Interaction between MARCH2 and NEMO in response to bacterial infection. Raw264.7 cells were infected with Listeria monocytogenes (H) or S. typhimurium (I) in a time‐dependent manner in the presence of MG132. Cell lysates were subjected to immunoprecipitation with an anti‐NEMO antibody, followed by immunoblotting with an anti‐MARCH2 antibody.
-
J
Confocal microscopy was conducted to examine time‐dependent co‐localization of MARCH2 and NEMO in HeLa cells expressing TLR2 upon zymosan treatment (100 μg/ml) in the presence of MG132 (10 μM). Arrow indicates the co‐localized NEMO and MARCH2 protein.
Data information: Scale bar (G, J), 10 μm. ns, not significant. *
P <
0.05, **
P <
0.01, ***
P <
0.001 (two‐tailed Student's
t‐test). Data are representative of at least two independent experiments, each with similar results, and are expressed as the mean ± SD of three biological replicates.
Source data are available online for this figure.