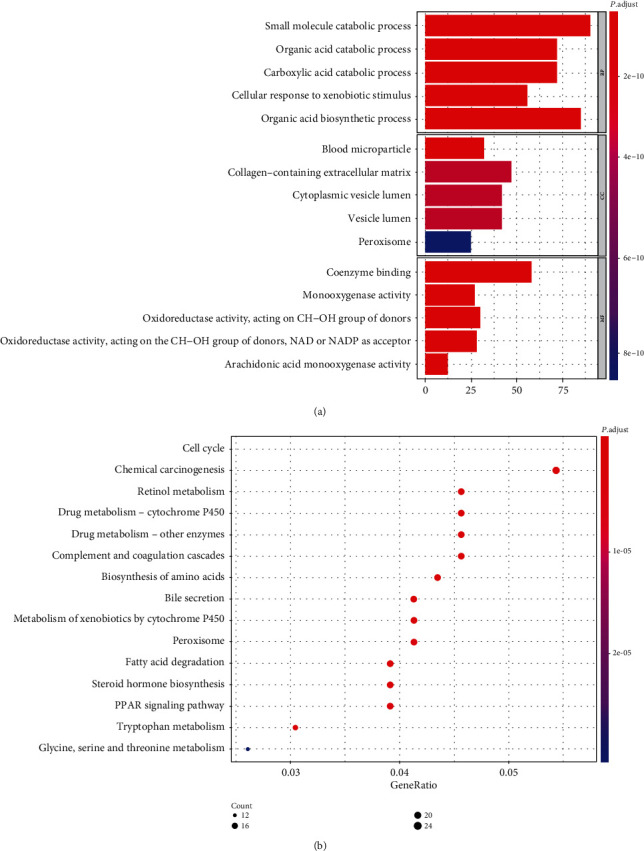
Figure 6.

GO and KEGG pathway analyses. (a) Bar graph of gene ontology enriched in molecular function, cellular component, and biological process. (b) KEGG pathway analysis.Abbreviations. KEGG: Kyoto Encyclopedia of Genes and Genomes; GO, Gene Ontology.
