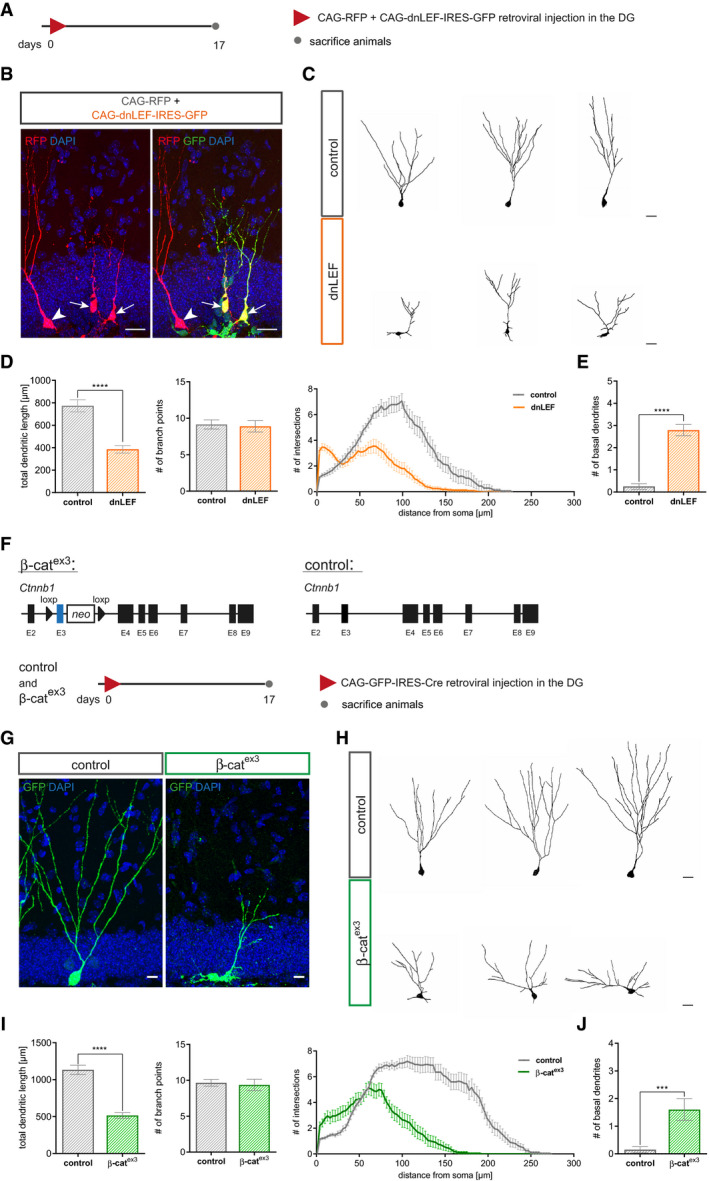
Experimental scheme of retroviral injection paradigm. Adult mice were stereotactically co‐injected with the MMLV CAG‐dnLEF‐IRES-GFP (dnLEF) and CAG‐RFP (control) and were sacrificed 17 dpi.
Representative images of transduced adult‐born neurons at 17 dpi. CAG‐dnLEF‐IRES-GFP (dnLEF, green) and CAG‐RFP (control, red) double transduced cells (arrows) and CAG‐RFP single transduced cells (arrowheads). Scale bar = 20 μm.
Representative reconstructions of control and dnLEF neurons. Scale bar = 20 μm.
Analysis of morphology showed a reduction in dendritic length in dnLEF‐transduced neurons (P < 0.0001), while the number of branch points remained comparable (P = 0.7914). Sholl analysis displayed a reduction in dendritic complexity in dnLEF‐transduced neurons and indicated decreased growth of terminal dendritic branches (P < 0.0001; control: n = 20 cells from three animals, dnLEF: n = 38 cells from six animals).
dnLEF neurons displayed basal dendrites (P < 0.0001; control: n = 20 cells from three animals, dnLEF: n = 38 cells from six animals).
Schematic representation of the conditional alleles of the Ctnnb1(ex3)fl (β‐catex3) mouse model and the retroviral paradigm used to analyze canonical Wnt signaling gain of function in neural progenitors. Control animals harbor the wild‐type allele for Ctnnb1.
Representative images depicting CAG‐GFP-IRES‐Cre transduced adult‐born neurons in control and β‐catex3 mice at 17 dpi. Scale bar = 20 μm.
Representative reconstructions of control and β‐catex3 neurons. Scale bar = 20 μm.
Quantification showed decreased dendritic length of β‐catex3 neurons (P < 0.0001); no difference was apparent in number of branch points (P = 0.3256). Sholl analysis displayed a less complex dendritic tree of β‐catex3 neurons (P < 0.0001; control: n = 20 cells from five animals, β‐catex3: n = 20 cells from five animals).
The number of basal dendrites was increased in β‐catex3 neurons (P = 0.0003; control: n = 20 cells from five animals, β‐catex3: n = 20 cells from five animals).
Data information: Data represented as mean ± SEM, significance was determined using two‐way ANOVA for Sholl analysis and two‐tailed Mann–Whitney
‐test for all other analyses, and significance levels were displayed in GP style (***
< 0.0001).