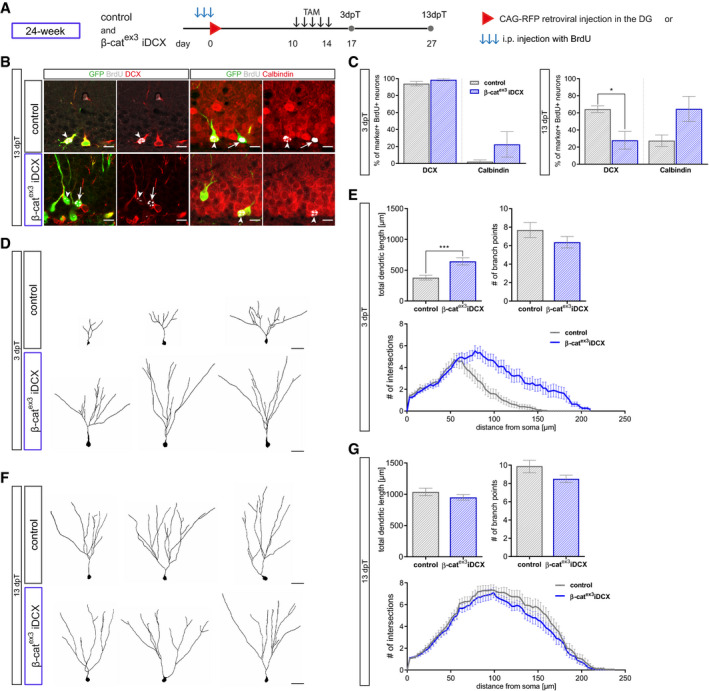
Birthdating of adult‐born neurons prior to recombination was conducted in 24‐week-old mice. For marker expression analysis, BrdU was injected i.p. every 24 h for 3 days (B, C); for morphology analysis, CAG‐RFP was stereotactically injected into the DG (D–G). Tamoxifen was applied i.p. every 12 h for 5 days. Mice were sacrificed 3 and 13 dpT.
Representative images of recombined (GFP+, green) BrdU+ (gray) neurons in 24‐week-old control and β‐catex3 iDCX animals at 13 dpT expressing the stage‐specific markers DCX (red) for immature neurons and Calbindin (red) for mature neurons. Arrows and arrowheads indicate marker‐negative and marker‐positive cells, respectively. Scale bar = 10 μm.
Quantification of DCX and Calbindin expression in BrdU+ recombined cells. At 13 dpT, labeled neurons in β‐catex3 iDCX animals show a shift toward a more mature marker profile (DCX P = 0.0238, Calbindin P = 0.0714) (3 dpT: control: n = 4 animals, β‐catex3 iDCX: n = 8 animals; 13 dpT control: n = 5 animals, β‐catex3 iDCX: n = 5 animals).
Representative reconstructions of RFP‐birthdated control and β‐catex3 iDCX neurons in 24‐week-old mice at 3 dpT. Scale bar = 20 μm.
Quantification of dendritic length (P = 0.0007), branch points (P = 0.3909), and Sholl analysis (P = 0.0001) showed increased complexity of birthdated β‐catex3 iDCX cells at 3 dpT (control: n = 20 cells from four animals, β‐catex3 iDCX: n = 19 cells from five animals).
Representative reconstructions of RFP‐birthdated control and β‐catex3 iDCX neurons in 24‐week-old mice at 13 dpT. Scale bar = 20 μm.
Quantification of dendritic length (P = 0.1857), branch points (P = 0.1331), and Sholl analysis (P = 0.1501) showed no difference between β‐catex3 iDCX and control cells at 13 dpT (control: n = 18 cells from four animals, β‐catex3 iDCX: n = 20 cells from four animals)
Data information: Data represented as mean ± SEM, significance was determined using two‐way ANOVA for Sholl analysis and two‐tailed Mann–Whitney
‐test for all other analyses, and significance levels are displayed in GP style (*
< 0.0002).

