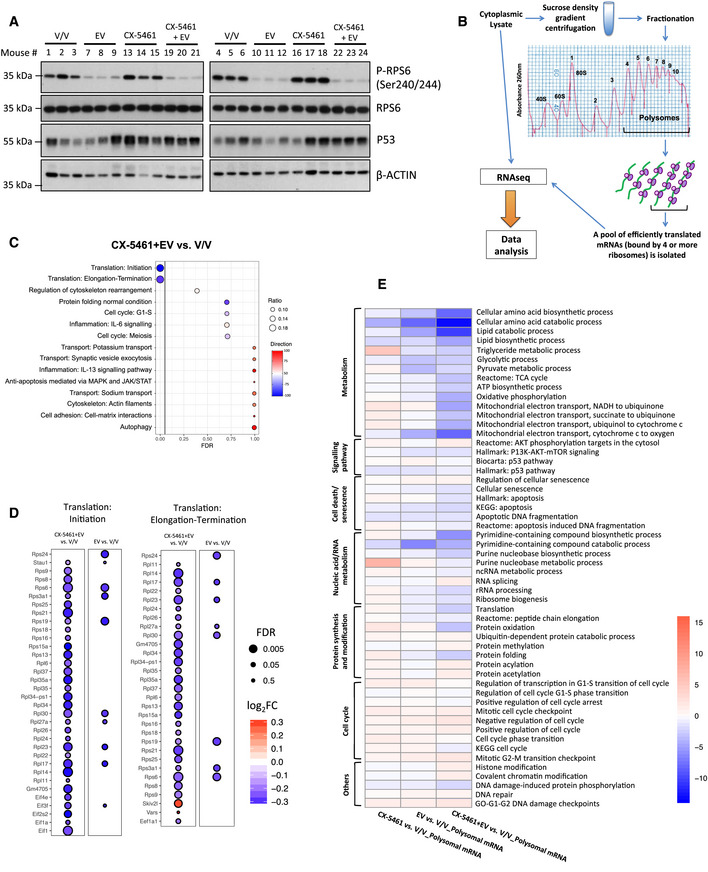
Figure 1. Acute inhibition of ribosome synthesis and function in vivo reduces translation of components of the translational machinery and decreases the abundance of polysome‐associated, energy metabolism‐related mRNAs.

- Western analysis for on‐target effects for everolimus (EV, P‐RPS6) and CX‐5461 (p53). Each lane represents equal amounts of protein from lymph node tissue isolated from a single mouse that received drug vehicles (everolimus vehicle: 1% methylcellulose; CX‐5461 vehicle: 25 mM NaH2PO4; V/V; mouse #1–6), 5 mg/kg everolimus (EV; mouse #7–12), 35 mg/kg CX‐5461 (mouse #13–18), or both drugs (CX‐5461 + EV; mouse #19–24) for 2 h (n = 6 per treatment group). Actin was used as a loading control.
- A schematic illustration of the polysome profiling analysis workflow: Cytoplasmic lysate was layered on top of a linear 10–40% sucrose gradient, ultracentrifuged (222,228 g, 2¼ h at 4°C using SW41Ti rotor), and fractionated using the Foxy Jr Fraction Collector with constant monitoring of absorbance at 260 (A260) nm by an ISCO UA‐6 Absorbance Detector. Fractions (one fraction per minute: 800 μl per tube) corresponding to polysomal mRNAs that were bound by four or more ribosomes were pooled and analyzed by RNA‐seq followed by data analysis using anota2seq or limma.
- Enrichment analysis by MetaCore® GeneGO of genes in “translation up” (red) and “translation down” (blue) categories identified by anota2seq analysis comparing lymph node cells isolated from mice in CX‐5461 + EV treatment group with the V/V group (n = 6). “Ratio” values were obtained by dividing the number of significant genes in our data assigned to a molecular process by the total number of genes in the process in MetaCore®'s database.
- Activity levels of key biological processes involved in cellular growth, proliferation, and metabolism based on single sample gene set enrichment analysis (ssGSEA) of indicated comparisons. Percentage increase (red) or decrease (blue) in the activity levels of key biological processes involved in cellular growth, proliferation, and metabolism based on ssGSEA of indicated comparisons. Data were obtained from n = 6 mice per treatment group.
Source data are available online for this figure.
