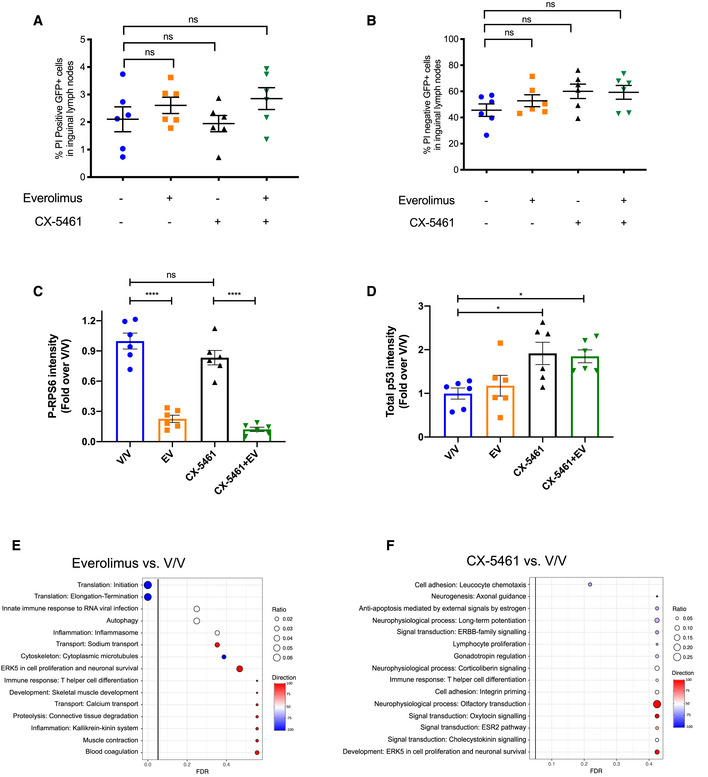
Figure EV1. In vivo transcriptome‐wide analysis of cellular response to ribosome‐targeting therapy.

-
A, BFlow cytometry analysis of inguinal lymph node cells that are (A) GFP‐positive and propidium iodide‐positive and (B) GFP‐positive and propidium iodide‐negative isolated from C57BL/6 mice with transplanted Eμ‐Myc lymphoma cells treated as indicated for 2 h. 10,000 viable cells of the correct morphology were collected for each sample. Graphs represent mean ± SEM of n = 6.
-
C, DQuantitation of (C) phosphorylated RPS6 levels normalized to total RPS6 and (D) p53 protein levels normalized to actin in Fig 1A. Graphs represent mean ± SEM of n = 6.
-
E, FEnrichment analysis by MetaCore® GeneGO of genes in “translation up” and “translation down” categories identified by anota2seq analysis comparing lymph node cells isolated from mice in (E) everolimus single‐agent treatment group or (F) CX‐5461 single‐agent treatment group with those isolated from mice in vehicle group (n = 6). “Ratio” is the value obtained by dividing the number of genes in an indicated molecular process that is found in our data with the number of genes curated in MetaCore®'s database. “Direction” visualizes the percentage of genes associated with indicated pathways that are up (red) or down (blue).
