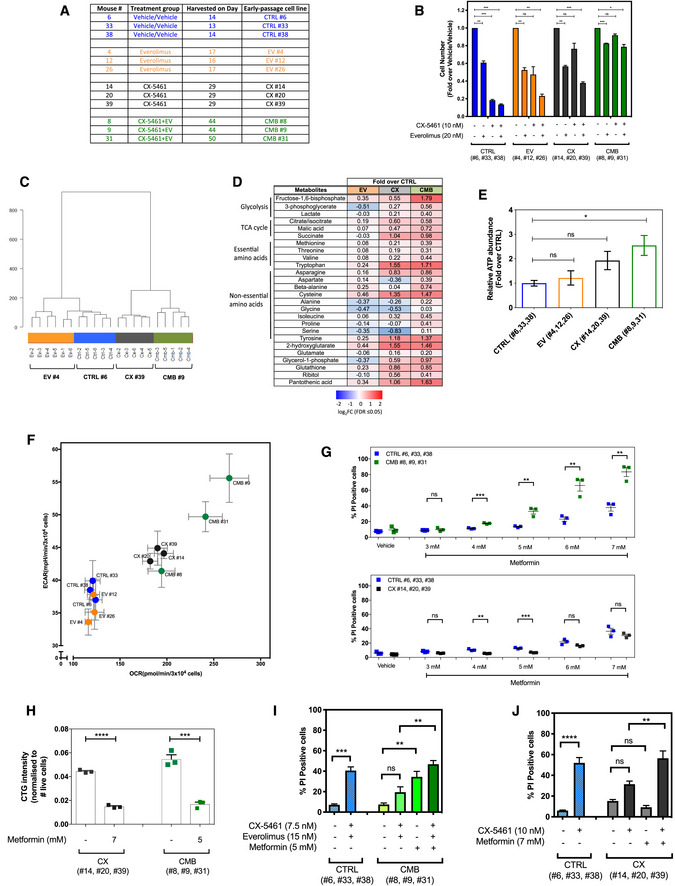
The early passage Eμ‐Myc lymphoma cells used in this study, which were established from mice that were drug‐naïve (“CTRL” cell lines), previously treated with everolimus (“EV” cell lines) or CX‐5461 (“CX” cell lines) alone, or combination of both (“CMB” cell lines). Harvest day indicates the number of days post‐transplantation of lymphoma cells.
Cell viability analysis of the indicated early passage Eμ‐Myc lymphoma cells treated with indicated compound(s) for 48 h as determined by Beckman® Coulter counter. Graphs represent mean ± SEM of n = 3. Data were analyzed by two‐way ANOVA.
Hierarchical clustering analysis of metabolomics data obtained from gas chromatography (GC)–mass spectrometry (MS) analysis of early passage cell lines (n = 5–6).
Steady‐state abundance of indicated metabolites (fold‐over CTRL cells; FDR ≤ 0.05; n = 5–6).
Intracellular ATP levels determined using the liquid chromatography–mass spectrometry in CTRL, EV, CX, and CMB early passage cell lines. Graphs represent mean ± SEM of n = 3.
Basal extracellular acidification rate (ECAR) and oxygen consumption rate (OCR) in the early passage cell lines determined using the Seahorse XF96 Extracellular Flux Analyzer; graphs represent mean ± SEM of 6–8 technical replicates for each biological replicate (n = 3).
Propidium iodide (PI) exclusion analysis of early passage CX‐5461-everolimus combination therapy‐resistant (CMB), CX‐5461-resistant (CX), and drug‐naïve (CTRL) lymphoma cells treated with indicated concentrations of metformin for 48 h. Graphs represent mean ± SEM of n = 3.
CellTiterGLO®‐based assay measuring cellular ATP levels of the CX-5461‐resistant (CX) and CX-5461‐everolimus combination therapy‐resistant (CMB) cells treated with metformin as indicated for 48 h. Graphs represent mean ± SEM of n = 3.
PI analysis of CTRL and CMB cells treated with CX‐5461 and everolimus in the presence and absence of metformin for 48 h as indicated. Graphs represent mean ± SEM of n = 3.
PI analysis of CTRL and CX cells treated with CX‐5461 in the presence and absence of metformin for 48 h as indicated. Graphs represent mean ± SEM of n = 3.
‐test. (E, I, J) Data were analyzed by one‐way ANOVA. ns, not significant,
≤ 0.0001.