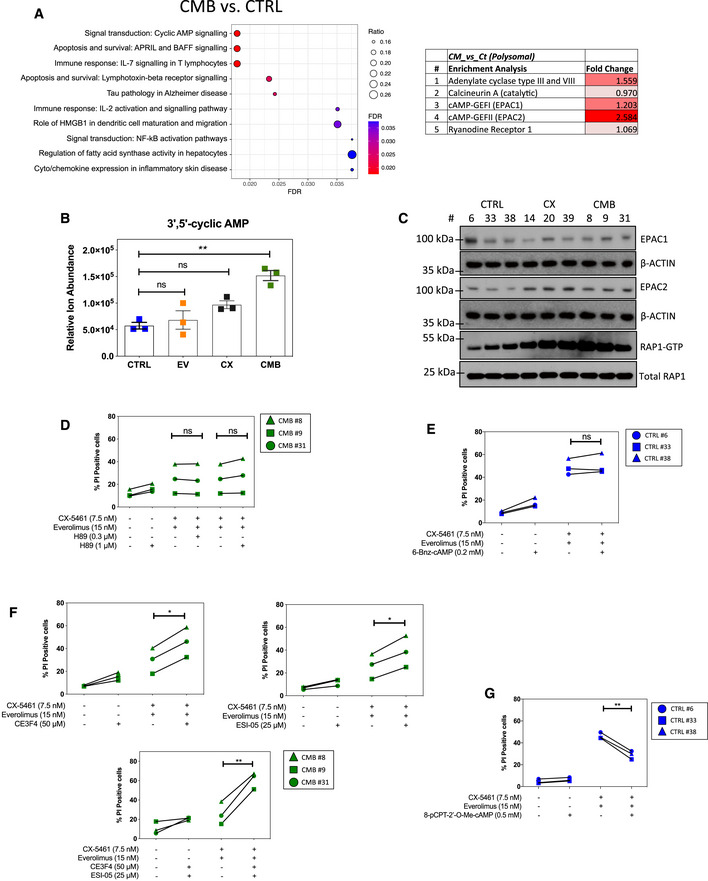
Enrichment analysis by GeneGO MetaCore® of the polysomal RNA‐seq data comparing CX‐5461 + EV‐resistant (CMB) and drug‐naïve cells (CTRL; n = 3; false discovery rate (FDR) ≤ 0.05; fold change (FC) ≥ 1.5 or ≤ ‐1.5).
Abundance of intracellular 3'5’‐cyclic AMP as measured by a liquid chromatography (LC)–mass spectrometry (MS) analysis. Graphs represent mean ± SEM of n = 3 (5–6 technical replicates each). Data were analyzed by one‐way ANOVA. CTRL vs. EV, P = 0.8951; CTRL vs. CX, P = 0.0871; CTRL vs. CMB, P = 0.0012.
Western analysis of EPAC1 and EPAC2 abundance, as well as active GTP‐bound RAP1 levels in the indicated early passage cells during their log‐phase growth period (
n = 3). Actin and total RAP1 were used as loading controls. Quantitations of the blots are shown in
Appendix Fig S3A–C.
Propidium iodide (PI) exclusion assays of CMB cells treated with CX‐5461 and everolimus as indicated in the presence or absence of a selective PKA inhibitor H89 for 48 h.
PI exclusion analysis of early passage drug‐naïve (CTRL) lymphoma cells treated with CX‐5461 and everolimus in the presence or absence of selective PKA activator 6‐Bnz-cAMP for 48 h.
PI exclusion analysis of the CMB cells treated with CX‐5461 and everolimus as indicated in the presence or absence of EPAC1 inhibitor CE3F4 or EPAC2 inhibitor ESI‐05 for 48 h.
PI exclusion analysis of early passage drug‐naïve (CTRL) cells treated with CX‐5461 and everolimus in the presence or absence of the selective EPAC activator 8‐pCPT-2‐O-Me-cAMP for 48 h.
Data information: (D, E, F, G) Data (
n = 3) were analyzed by paired one‐way ANOVA. Green triangle: CX‐5461‐everolimus combination therapy‐resistant (CMB) cells clone #8; green square: CMB cells clone #9; green circle: CMB cells clone #31. Blue circle: early passage drug‐naive (CTRL) cells clone #6; blue square: CTRL cells clone #33; blue triangle: CTRL cells clone #38. ns, not significant,
P ≥ 0.05; *
P ≤ 0.05; **
P ≤ 0.01.
Source data are available online for this figure.

