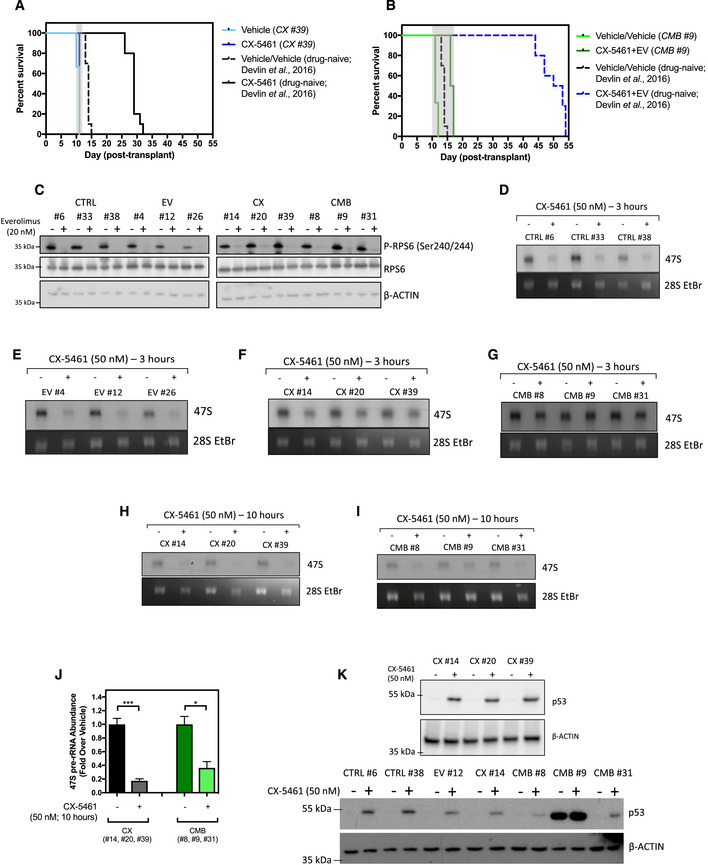
Figure EV3. In vitro and in vivo characterization of the early passage cell lines.

-
AKaplan–Meier curve of C57BL/6 mice transplanted with the CX-5461‐resistant CX #39 early passage Eμ‐Myc lymphoma cells treated with CX‐5461 (35 mg/kg every 3 days; n = 5–6). Survival curves of drug‐naïve cells were actual data reproduced from Devlin et al, 2016.
-
BKaplan–Meier curve of C57BL/6 mice transplanted with CX‐5461 + EV‐resistant CMB #9 early passage cells treated with CX‐5461 (35 mg/kg every 3 days) and everolimus (5 mg/kg daily; n = 5–6). Survival curves of drug‐naïve cells were actual data reproduced from Devlin et al, 2016.
-
CWestern blot analysis of markers for the on‐target effect of 20 nM everolimus treatment for 3 h, specifically phosphorylation of RPS6 at Serine 240/244 residues and total RPS6 (n = 3). Actin was used as a loading control.
-
D–JSynthesis rates of 47S pre‐rRNAs in (D) drug‐naïve (CTRL), (E) everolimus‐resistant (EV), (F) CX-5461‐resistant (CX), and (G) CX‐5461 + EV‐resistant (CMB) cell lines in response to 3‐h 50 nM CX‐5461 treatment were determined by 32P‐orthophosphate “pulse” labeling. Synthesis rate of 47S pre‐rRNAs in (H) CX and (I) CMB cell lines in response to 10‐h 50 nM CX‐5461 was determined by 32P‐orthophosphate “pulse” labeling and (J) its quantitation (n = 3). (D–I) 28S rRNA abundance was used as a loading control. EtBr: ethidium bromide. Data were analyzed by Student's t‐test. Graphs represent mean ± SEM of n = 3. *P ≤ 0.05. ***P ≤ 0.001.
-
KWestern blot analysis for p53 abundance in response to 50 nM CX‐5461 treatment for 3 h. Actin was used as a loading control (n = 2–3).
Source data are available online for this figure.
