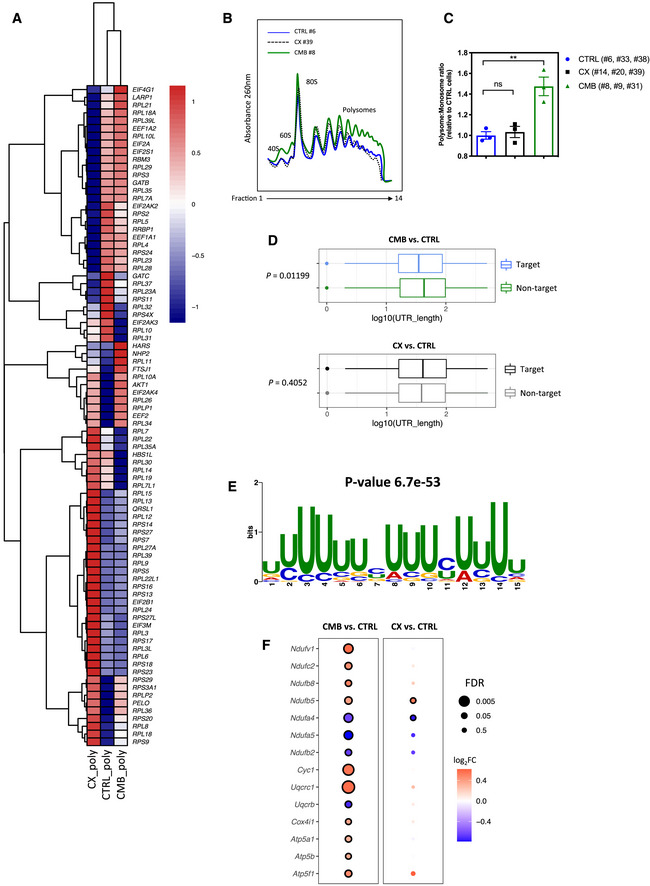
Figure 4. Polysome profiling analysis identifies a link between translational reprogramming and resistance to CX‐5461 and CX‐5461 + everolimus.

- A heatmap illustrating the abundances of polysome‐associated mRNAs that are associated with the mRNA translation/protein synthesis based on the Gene Ontology Resource Database in drug‐naïve (CTRL) or CX-5461‐everolimus combination therapy‐resistant (CMB) cell lines (n = 3). The colors illustrate the expression values of indicated mRNAs that were normalized using voom (red: high expression; blue: low expression). Values represent the median gene expression levels across replicate samples.
- Polysome profiles demonstrating increased ribosome abundance in CMB cells as compared to CTRL and CX-5461‐resistant (CX) cells (representatives of n = 3).
- Quantitation of polysome:monosome ratio in the indicated early passage Eμ‐Myc lymphoma cells as determined by measuring the area under the curve using ImageJ software. Graph represents mean ± SEM of n = 3. Data were analyzed by one‐way ANOVA. ns, not significant; **P ≤ 0.01.
- Length of the 5'UTR of mRNAs that are more actively translated by the CMB cells (as compared to CTRL cells) vs. non‐target mRNAs (n = 3). The central band corresponds to the median. The lower and upper hinges correspond to the first and third quartiles (the 25th and 75th percentiles). The upper and lower whiskers extend from the hinges to the largest and smallest values no further than 1.5 * interquartile range from the hinges, respectively. Data beyond the end of the whiskers are plotted individually. One‐sided Wilcoxon tests were used to determine significance.
- The most significantly enriched motif in the 5'UTR of mRNAs that are more actively translated in the CMB cells compared to CTRL cells based on Multiple Em for Motif Elicitation (MEME) analysis (n = 3).
- Polysomal abundance of mRNAs (selected based on a nominal P value < 0.01 cut‐off in either the CMB vs. CTRL or CX vs. CTRL as analyzed by limma) encoding components of mitochondrial oxidative phosphorylation based on polysome profiling data. Red denotes upregulation, and blue denotes downregulation (n = 3; genes with an adjusted P value (false discovery rate; FDR) ≤ 0.05 were considered to be significant and are denoted with a black border).
Source data are available online for this figure.
