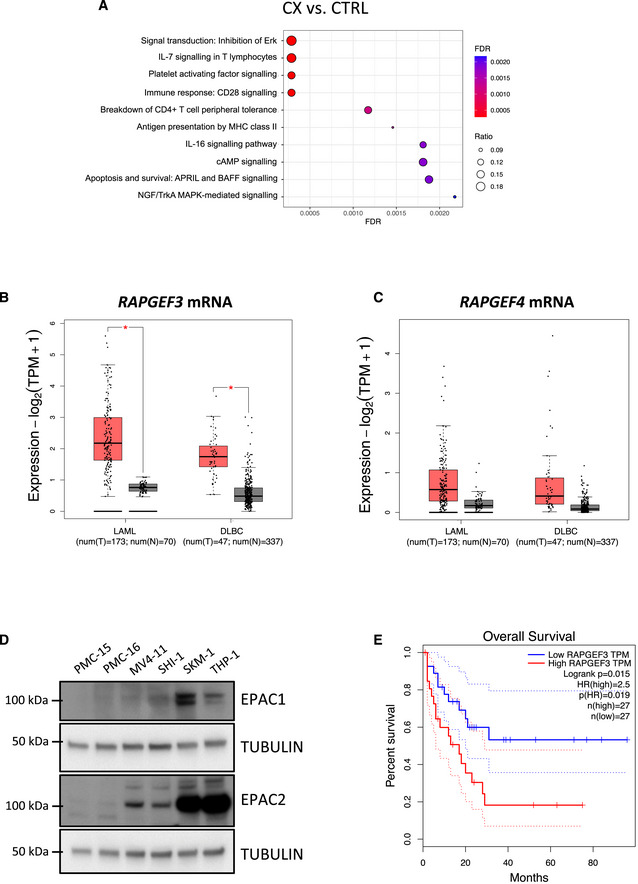
Figure EV4. Polysome profiling analysis of the early passage Eμ‐Myc lymphoma “CX” cell lines and investigating potential roles of RAPGEF3 (EPAC1) and RAPGEF4 (EPAC2) in human blood cancers.

-
AEnrichment analysis by GeneGO MetaCore® of the polysomal RNA‐seq data comparing CX‐5461‐resistant (CX) and drug‐naïve cells (CTRL; n = 3; false discovery rate (FDR) ≤ 0.05; fold change (FC) ≥ 1.5 or ≤ ‐1.5).
-
B, CMedian mRNA expression levels of (B) RAPGEF3 (mRNA encoding EPAC1 protein) and (C) RAPGEF4 (mRNA encoding EPAC2 protein) generated by gene expression profiling interactive analysis (GEPIA) bioinformatics web tool based on The Cancer Genome Atlas (TCGA) database. LAML: acute myeloid leukemia (tumor, n = 173; normal, n = 70). DLBC: diffuse large B‐cell lymphoma (tumor, n = 47; normal, n = 337). Red: tumor, black: normal. The central band corresponds to the median. The lower and upper hinges correspond to the first and third quartiles (the 25th and 75th percentiles). The upper and lower whiskers extend from the hinges to the largest and smallest values no further than 1.5 * interquartile range from the hinges, respectively. Data points are plotted individually. Data were analyzed by one‐way ANOVA; *P < 0.05. tpm, transcript count per million.
-
DWestern analysis of EPAC1 and EPAC2 abundance in white blood cell samples (isolated from healthy donors #PMC-15 and #PMC-16) versus MV4‐11, SHI‐1, SKM1, and THP1 human AML cell lines (representative of n = 2).
-
ESurvival curves of AML patients with low and high EPAC1 (RAPGEF3; n = 27 each; cut‐off: 50%) generated by GEPIA based on TCGA database.
Source data are available online for this figure.
