-
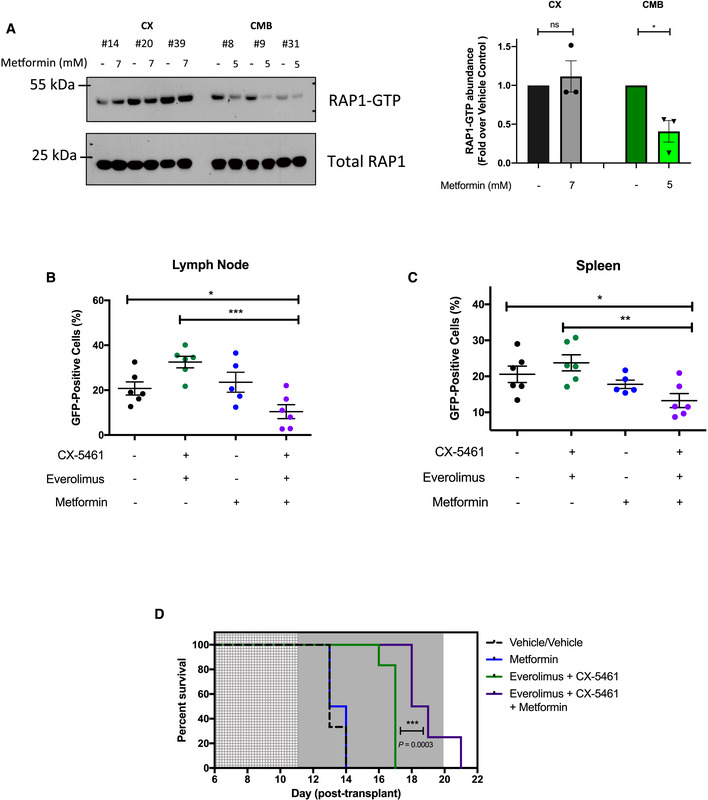
A
Western analysis demonstrating the effects of metformin treatment for 48 h on the levels of active GTP‐bound RAP1 in CX and CMB cells (n = 3) and its quantitation.
-
B, C
Proportion of green fluorescent protein (GFP)‐positive CMB (clone #8) cells in (B) lymph node and (C) spleen of transplanted C57BL/6 mice treated as indicated for 6 h on day 12 post‐transplant. Graphs represent mean ± SEM of six mice per group.
-
D
Kaplan–Meier curve of C57BL/6 mice transplanted with CX‐5461‐everolimus‐resistant (CMB #8) early passage Eμ‐Myc lymphoma cells treated with vehicles (everolimus vehicle: 1% methylcellulose; CX‐5461/metformin vehicle: 25 mM NaH2PO4; n = 6); CX‐5461 (35 mg/kg every twice weekly) and everolimus (5 mg/kg daily; n = 8), metformin (400 mg/kg twice daily; n = 6), or CX‐5461, everolimus and metformin (35 mg/kg twice weekly, 5 mg/kg daily and 400 mg/kg twice daily, respectively; n = 8). Light gray: 5‐day metformin pre‐treatment period, dark gray: treatment period. Data were analyzed by a log‐rank (Mantel–Cox) test. Vehicle vs. CX-5461‐everolimus: P = 0.0006, Vehicle vs. CX-5461‐everolimus‐metformin: P = 0.0001. CX-5461‐everolimus vs. CX-5461‐everolimus‐metformin: P = 0.0003.
Data information: (A) Graphs represent mean ± SEM of
n = 3. Data were analyzed by Student's
t‐test (A) or one‐way ANOVA (B, C). ns, not significant,
P ≥ 0.05; *
P ≤ 0.05; **
P ≤ 0.01; ***
P ≤ 0.001.
Source data are available online for this figure.