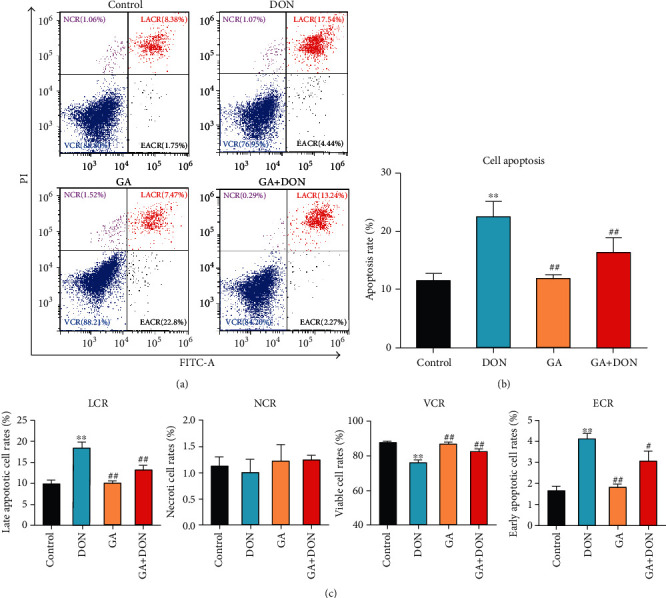
Figure 2.

GA alleviating cytotoxicity of DON-induced IPEC-J2 cells. (a) Flow cytometry analysis of Annexin V/FITC/PI staining cells; LACR, NCR, VCR, and EACR represent the late apoptotic cell rates, necrotic cell rates, viable cell rates, and early apoptotic cell rates, respectively. (b) Quantification of the total cell apoptotic rates (early apoptotic cell rates+late apoptotic cell rates). (c) Quantification and analysis of the late apoptotic cell rates, necrotic cell rates, viable cell rates, and early apoptotic cell rates in four groups. DON: the single DON (0.5 μg/mL) group; GA: the single GA (400 μg/mL) group; GA+DON: 400 μg/mL GA+0.5 μg/mL DON group. ∗∗P < 0.01 indicates the significant difference, compared with the control group; #P < 0.05 and ##P < 0.01 indicate the significant difference, compared with the DON group.
