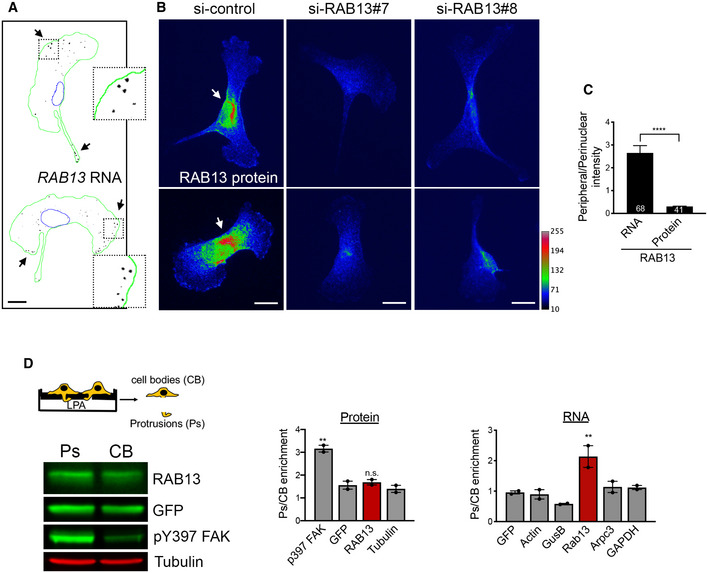
Figure 1. RAB13 RNA and protein exhibit distinct subcellular distributions.

- Representative FISH images showing RAB13 RNA distribution in MDA‐MB-231 cells. Nuclei and cell outlines are shown in blue and green, respectively. Arrows point to RAB13 RNA concentrated at protrusive regions. Boxed regions are magnified in the insets.
- Representative immunofluorescence images of RAB13 protein in cells transfected with the indicated siRNAs. Reduction of intensity in RAB13 knockdown cells confirms the specificity of the signal. Arrows point to perinuclear RAB13 protein. Calibration bar shows intensity values.
- Ratios of peripheral/perinuclear intensity calculated from images as shown in (A) and (B). Bars: mean ± s.e.m. Values within each bar represent number of cells observed in 3 independent experiments.
- Protrusions (Ps) and cell bodies (CB) of cells induced to migrate toward LPA were isolated and analyzed to detect the indicated proteins (by Western blot; left panels) or RNAs (by RT‐ddPCR; right panel). Ps/CB enrichment ratios from 2 independent experiments are shown. Bars: mean ± s.e.m. The enrichment of pY397‐FAK serves to verify the enrichment of protrusions containing newly formed adhesions in the Ps fraction.
