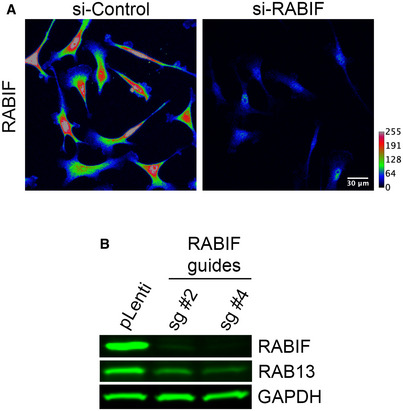
Figure EV5. RABIF distribution and effect on RAB13 expression.

- Representative immunofluorescence images of RABIF protein in cells transfected with the indicated siRNAs. Reduction of intensity in knockdown cells confirms the specificity of the signal. Calibration bar shows intensity values. Note that RABIF exhibits a mostly perinuclear enrichment.
- RAB13 expression in cells with CRISPR knockdown of RABIF using the indicated sgRNAs (see also Fig 7C).
