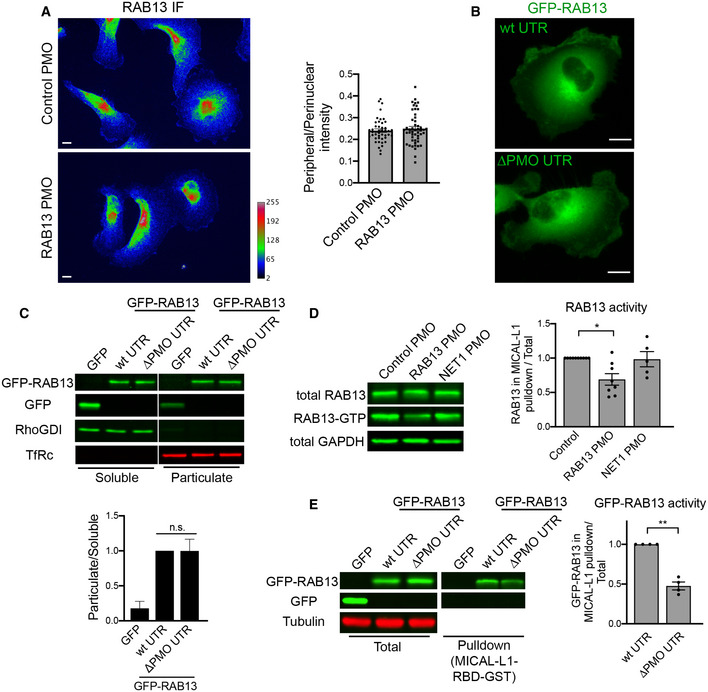
Figure 6. Peripheral RAB13 RNA translation is required for RAB13 protein activation but not steady‐state distribution or membrane association.

-
AWide‐field images of RAB13 immunofluorescence in MDA‐MB-231 cells treated with control or RAB13 (191 + 230) PMOs and ratios of peripheral/perinuclear intensity. Scale bars: 10 μm. n = 45–50 cells. Bars: mean ± s.e.m. Similar results were observed in two additional independent experiments.
-
BFluorescence images (projections of confocal slices throughout the cell height) of cells expressing GFP‐RAB13 with the indicated UTRs. Note that in both cases the protein assumes indistinguishable distribution. Scale bars: 10 μm.
-
CSoluble/particulate fractionation of the indicated cell lines followed by Western blot to detect the indicated proteins. RhoGDI and TfRc serve as soluble and particulate markers, respectively. Graph shows quantitation from n = 3 independent experiments. Bars: mean ± s.e.m.
-
D, EActive RAB13 (RAB13‐GTP) was pulled down using MICAL‐L1 RBD‐GST from the indicated PMO‐treated cells (D) or GFP‐RAB13‐expressing lines (E). The amount of endogenous or exogenous RAB13 was measured by quantitative Western blot, and relative levels of active RAB13 are plotted. n = 8 (D), n = 4 (E). Bars: mean ± s.e.m.
