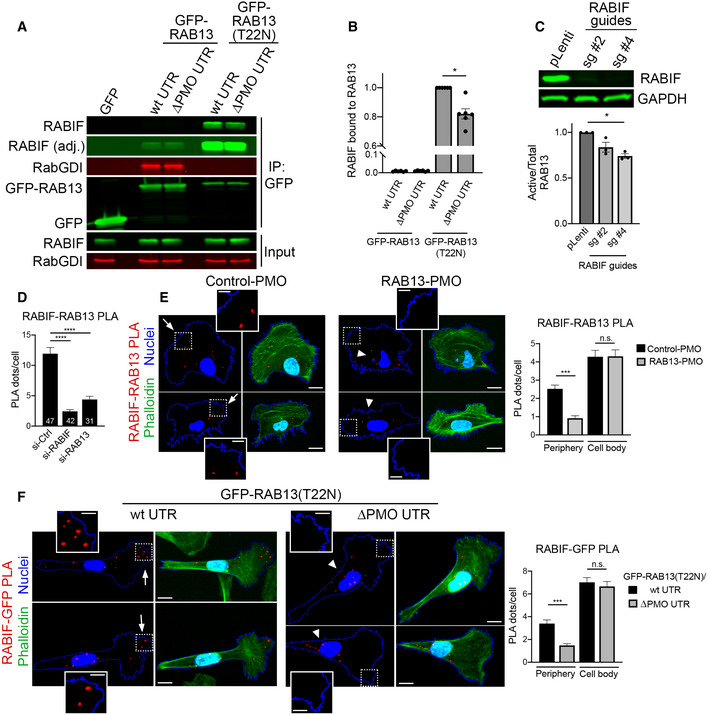
Immunoprecipitation and Western blot analysis to detect proteins bound to GFP‐RAB13 expressed from constructs carrying wt or ΔPMO RAB13 3′UTR. GFP‐RAB13 (T22N) expresses a nucleotide‐free mutant which binds tightly to putative GEFs. RABIF panel is also shown with adjusted contrast to reveal lower binding to wtGFP‐RAB13.
Quantification of RABIF binding to RAB13 from experiments as in (A). n = 6. Bars: mean ± s.e.m.
Active RAB13 pull‐down assay from cells with CRISPR knockdown of RABIF using the indicated sgRNAs. n = 3. Bars: mean ± s.e.m.
Quantification of RABIF‐RAB13 PLA signal from cells transfected with the indicated siRNAs. Number of observed cells is indicated within each bar. Bars: mean ± s.e.m. Similar results were observed in one additional independent experiment.
Representative RABIF‐RAB13 PLA images and quantitations from cells transfected with the indicated PMOs. N > 70 cells. Bars: mean ± s.e.m. Arrows indicate PLA signal at the cell periphery. Arrowheads indicate PLA signal within the cell body. Boxed regions are magnified in the insets. Scale bars: 15 μm; 5 μm in insets.
Representative RABIF‐GFP PLA images and quantitations from cells expressing GFP‐RAB13(T22N) carrying wt or ΔPMO RAB13 3′UTR. N > 70 cells. Bars: mean ± s.e.m. Arrows indicate PLA signal at the cell periphery. Arrowheads indicate PLA signal within the cell body. Boxed regions are magnified in the insets. Scale bars: 10 μm; 4 μm in insets.
Data information:
P‐values: *< 0.05, **< 0.01, ***< 0.001, ****< 0.0001 by Wilcoxon matched‐pairs signed‐rank test (B) or analysis of variance with Dunn's, Dunnett's, or Tukey's multiple comparisons test (C–F).
Source data are available online for this figure.

