-
A
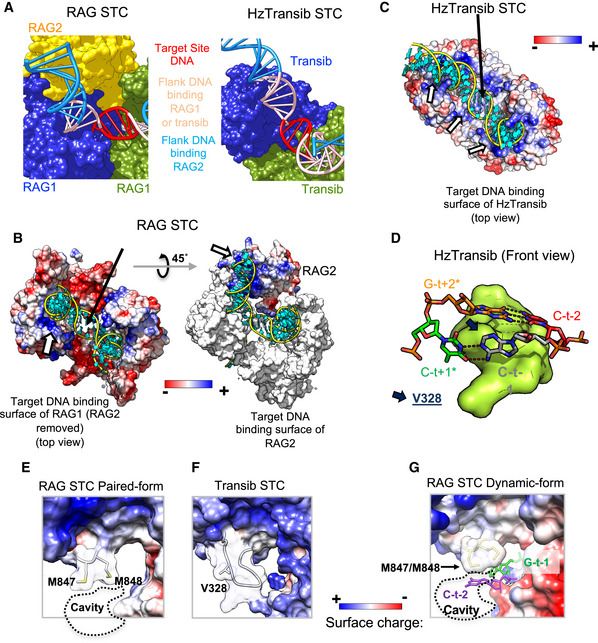
Diagram to show the extent of flank DNA binding for RAG and HzTransib in the STC. Red, target site DNA; light pink, flank DNA bound by both RAG1 and HzTransib; blue, remainder of flank DNA, much of which is contacted by RAG2 in the RAG STC.
-
B
Left, structure of paired RAG STC with RAG2 omitted (top view). RAG1 protein is shown as an electrostatic surface and target DNA in cartoon mode with the backbone colored yellow and base colored cyan. The white arrow indicates the positively charged surface for target DNA binding on RAG1. Right, structure of the paired RAG STC with one RAG2 shown (45° rotation relative to A). RAG1 is shown as a molecular surface and colored white. RAG2 is shown as an electrostatic surface. The white arrow indicates the positively charged surface for target DNA binding on RAG2.
-
C
HzTransib STC structure is shown as for RAG in (B). Three white arrows indicate the positively charged surface provided by HzTransib for target DNA binding.
-
D
Front view of HzTransib STC near the integration site (PDB:6PR5), depicted as in Fig
3D.
-
E, F
Protein electrostatic surface around M847/M848 of RAG1 in the paired STC and equivalent region of HzTransib STC. Loop region rendered transparent. Dashed line, cavity formed due to shorter loop in RAG1.
-
G
A similar view of RAG dynamic STC as shown in (E) depicting bases C‐t−2 and G‐t−1 which are flipped and project into the cavity below target site DNA in the RAG STC.
Data information: In (B) and (C), black arrows indicate the location of target site DNA and the cavity/protein underneath it for RAG and HzTransib, respectively.

