
Figure EV1. TIF formation in DC cells.
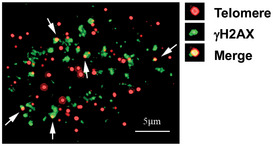
Enlarged view of the upper right panel of Fig 6C, showing a representative image with γH2AX (green) and telomere immuno‐FISH (red) in a DC cell. White arrows: co‐localization of γH2AX foci and telomeric DNA (or TIF). Enlarged view of co‐localizing foci is shown at the right panel.