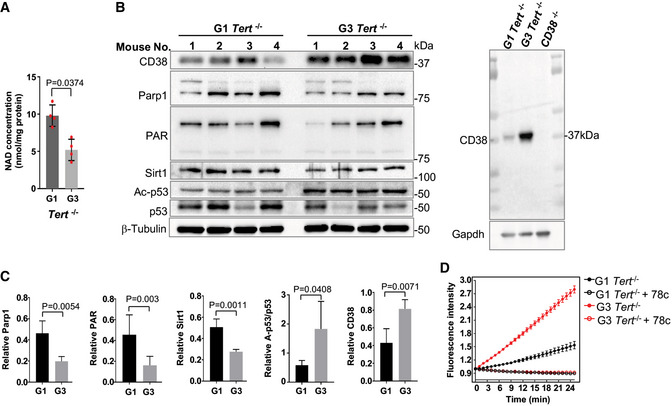
Figure 3. G3 Tert −/− mice display defects in the NAD metabolism.

-
A, BIntracellular NAD levels and immunoblots of the expression of NAD consuming‐related proteins and their activities in brain tissues from 6‐month‐old G1 and G3 Tert −/− female mice. The CD38 antibody was validated using the CD38 −/− mouse brain tissues.
-
CQuantification of immunoblots from the indicated proteins in (B).
-
DNADase activity in G1 and G3 Tert −/− mouse brain lysate was determined at various time points during the reaction. NADase activity was not detectable in the extracts treated with the CD38 inhibitor, 78c, at a concentration of 50 nM.
