-
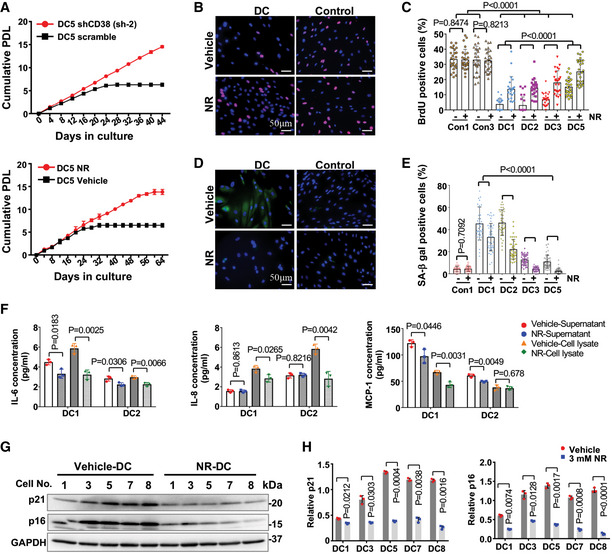
A
Cumulative population doubling analysis of the proliferation of representative scramble and CD38 knockdown DC fibroblasts or DC fibroblasts treated with vehicle or 3 mM NR. Each data point is represented as mean ± SD of three replicates.
-
B, C
Representative images of BrdU (red) and DAPI (blue) staining of DC and age‐matched healthy control fibroblasts treated with vehicle or NR. Percentage of BrdU‐positive cells per condition. Each dot represents the percentage of cells with BrdU staining per image. Approximately 400 cells were counted per condition. All values are presented as mean ± SD.
-
D, E
Representative images of SPiDER‐β‐gal (green) and DAPI (blue) staining of DC and age‐matched healthy control cells treated with vehicle or 3 mM NR. Percentage of SA‐β‐gal-positive cells per condition. Each dot represents the percentage of cells with SA‐β‐gal staining per image. Approximately 400 cells were counted per condition. All values are presented as mean ± SD.
-
F
The levels of IL‐6, IL‐8, and MCP‐1 in both supernatant and cell lysate of indicated DC fibroblasts treated with vehicle or 3 mM NR. All values are represented as mean ± SD of three replicates.
-
G, H
Representative immunoblots of p21 and p16 in DC fibroblasts treated with vehicle or 3 mM NR. Quantification of the indicated proteins is presented as mean ± SD from three immunoblots.
Data information:
P values were calculated using one‐way ANOVA for multiple comparisons (C) and Student's
t‐test between two groups (C, E, F, and H). Con: control.