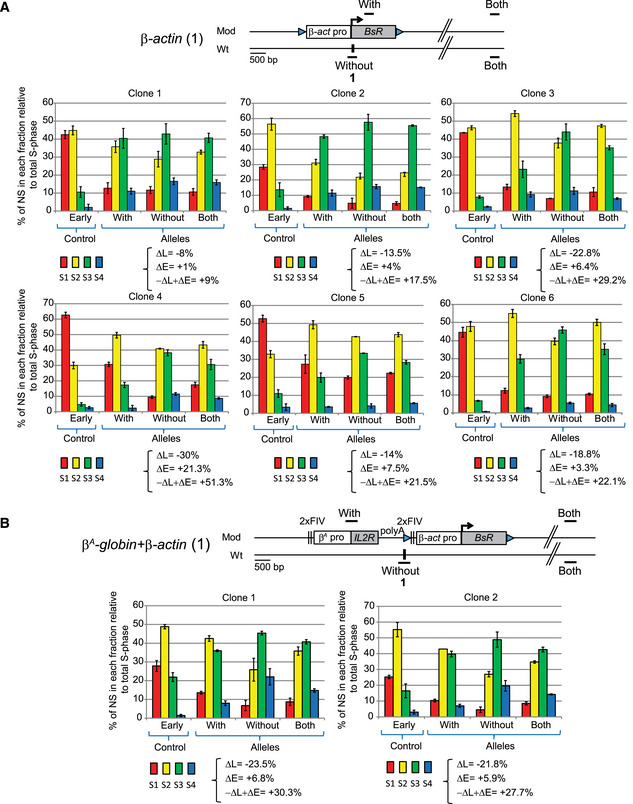
RT profiles of each chromosomal allele are determined after targeted transgene integration using the allele‐specific analysis of RT method by real‐time PCR quantification described in
Appendix Fig S1. Differences in –ΔL + ΔE values calculated at the target site following transgene integration are indicated. Blue triangles represent reactive
loxP sites. Error bars correspond to the standard deviation for qPCR duplicates. Analysis of six
β‐actin clonal cell lines (A) or two
β
A
‐globin + β‐actin clonal cell lines (B) described in Fig
1 is reported. Black vertical bars represent insertion sites.

