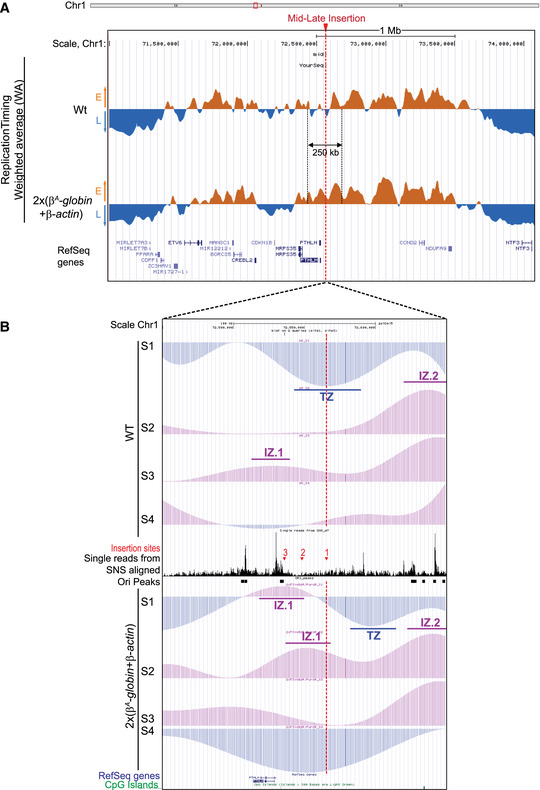
UCSC genome browser visualization of the mid‐late insertion site of chromosome 1 (genomic positions: chr1:72,450,000–72,650,000 bp; 200 kb; galGal5). Tracks of nascent strands (NS) enrichments in the four S‐phase fractions were represented separately (S1–S4) for the wt and the 2 × (
β
A
‐globin + β‐actin) cell lines. NS‐enriched and depleted regions for each fraction are represented in purple and blue, respectively. Single reads form SNS aligned and track of replication origins (Ori peaks) determined in (Massip
et al,
2019) are reported in between. The three mid‐late insertion sites 1, 2, and 3 are indicated with red arrows. Annotated genes and CpG Islands are shown below. Initiation zones (IZ) and termination zones (TZ) are reported.

