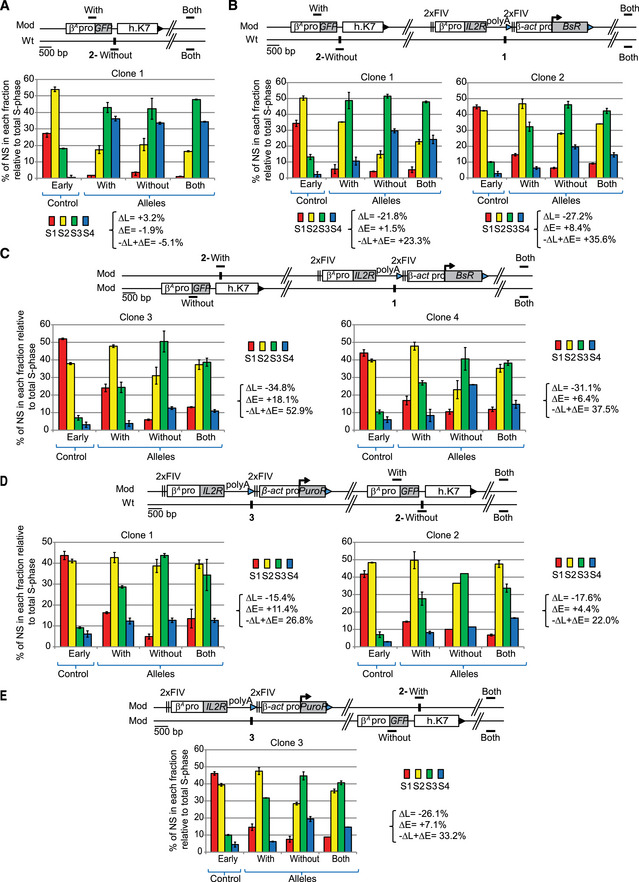
RT profiles of each chromosomal allele are determined after targeted transgene integration using the allele‐specific analysis of RT method by real‐time PCR quantification described in
Appendix Fig S1. Differences in –ΔL + ΔE values calculated at the target site following transgene integration are indicated.
-
A
Analysis of one clonal cell line containing one GFP reporter construct composed of the GFP reporter gene under the control of the β
A
‐globin promoter (β
A pro) and linked to a 1.6 kb fragment of human chromosome 7 (h.K7) inserted at site 2.
-
B, C
Analysis of clonal cell lines containing one
β
A
‐globin + β‐actin construct described in Fig
1 inserted at site 1 and one
GFP reporter construct inserted at site 2 on the same chromosome (B) or on the other chromosome (C).
-
D, E
Analysis of clonal cell lines containing one β
A
‐globin+β‐actin construct inserted at site 3 and one GFP reporter construct inserted at site 2 on the same chromosome (D) or on the other chromosome (E).
Data information: Blue and black triangles represent reactive
loxP sites and recombined inactive
loxP sites, respectively. Black vertical bars represent insertion sites. Error bars correspond to the standard deviation for qPCR duplicates.

