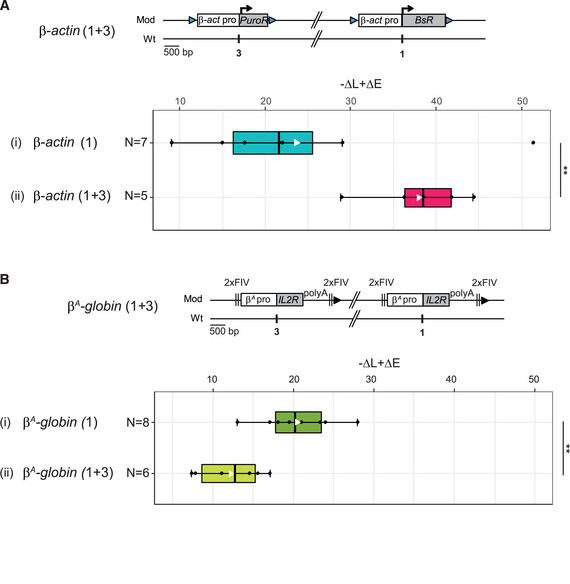
Distribution of –ΔL +ΔE values for clonal cell lines containing one β‐actin construct at site 1 (i, N = 7) or at site 1 and 3 (ii, N = 5), on the same chromosome.
Distribution of −ΔL + ΔE values for clonal cell lines containing one β
A
‐globin construct at site 1 (i, N = 8) or at site 1 and 3 (ii, N = 6), on the same chromosome.
Data information: (A, B) Blue and black triangles represent reactive
loxP sites and recombined inactive
loxP sites, respectively. Black vertical bars represent insertion sites. Rectangle edges correspond to the 0.25 and 0.75 quartiles, the thick black lines represent the median, the white triangles represent the mean and the whiskers extend to the smallest and largest –ΔL + ΔE values. Statistical analysis was performed with Wilcoxon nonparametric two‐tailed tests (**
P <
0.01).