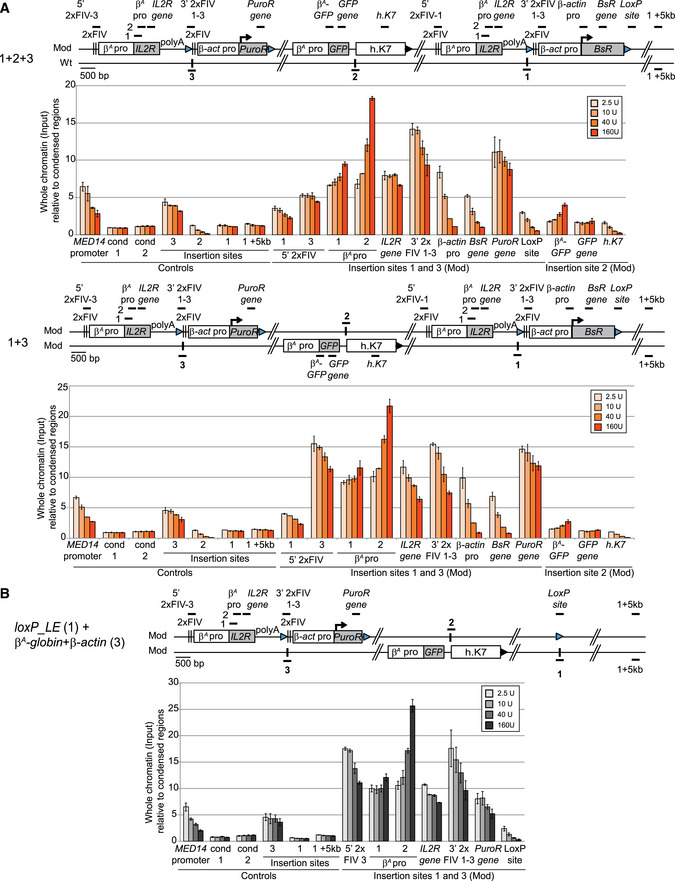
A, BClones 1 + 2 + 3, 1 + 3 (A), and loxP_LE (1) + β
A
‐globin + β‐actin (3) (B) were used to assess chromatin accessibility within the transgenes. The positions of the amplicons used for quantification in each shifting construct individually (thick black lines; 5′ 2xFIV‐1 or 2xFIV‐1-3, β‐actin pro‐1 or pro‐3, BsR gene, PuroR gene, LoxP site), in both shifting constructs (β
A pro 1 and 2, IL2R gene, 3′ 2xFIV1‐3) or in the GFP reporter construct (β
A‐GFP,GFP gene, h.K7) are shown. The insertion sites on the wt chromosome (insertion sites 1, 2, and 3) and a genomic region located 5 kb downstream from the insertion site (insertion site + 5 kb) were used as controls for the targeted genomic region. The endogenous active MED14 promoter was analyzed as a control. Blue and black triangles represent reactive loxP sites and recombined inactive loxP sites, respectively. Black vertical bars represent insertion sites. Quantifications by real‐time qPCR of total chromatin (input) extracted from two 1 + 2 + 3, 1 + 3, and loxP_LE (1) + β
A
‐globin + β‐actin (3) clonal cell lines, after digestion with micrococcal nuclease (MNAse, 2.5 U, 10 U, 40 U, 160 U/ml) and size selection were shown. Error bars indicate the standard deviation for qPCR triplicates, for two independent clones. Data are presented as total chromatin input relative to the condensed genomic regions (cond1 and cond2) used for the normalization.

