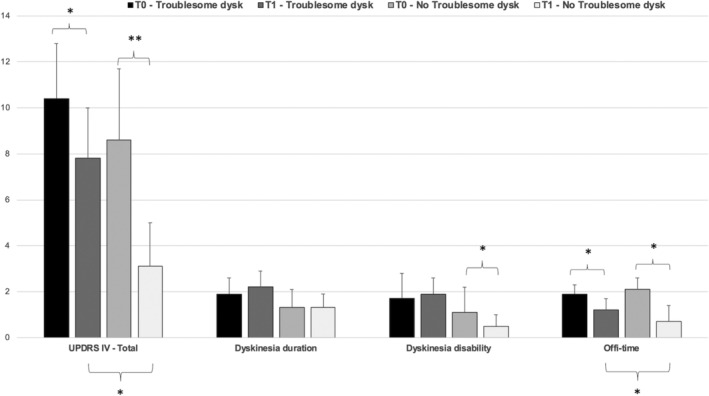
FIG 2.

UPDRS‐IV total score and sub‐items (item 32, dyskinesia duration, item 33 dyskinesia disability and item 39, off‐time) at baseline (T0) and follow‐up (T1), stratified for patients with troublesome dyskinesia at T1 (n = 36) and without troublesome dyskinesia at T1 (n = 17). T0 versus T1 statistical significant differences (*P < 0.05 and **P < 0.01) in the upper part of the figure and for groups comparisons (patients with troublesome vs. non troublesome dyskinesia at T1) at the bottom.
